QUESTION IMAGE
Question
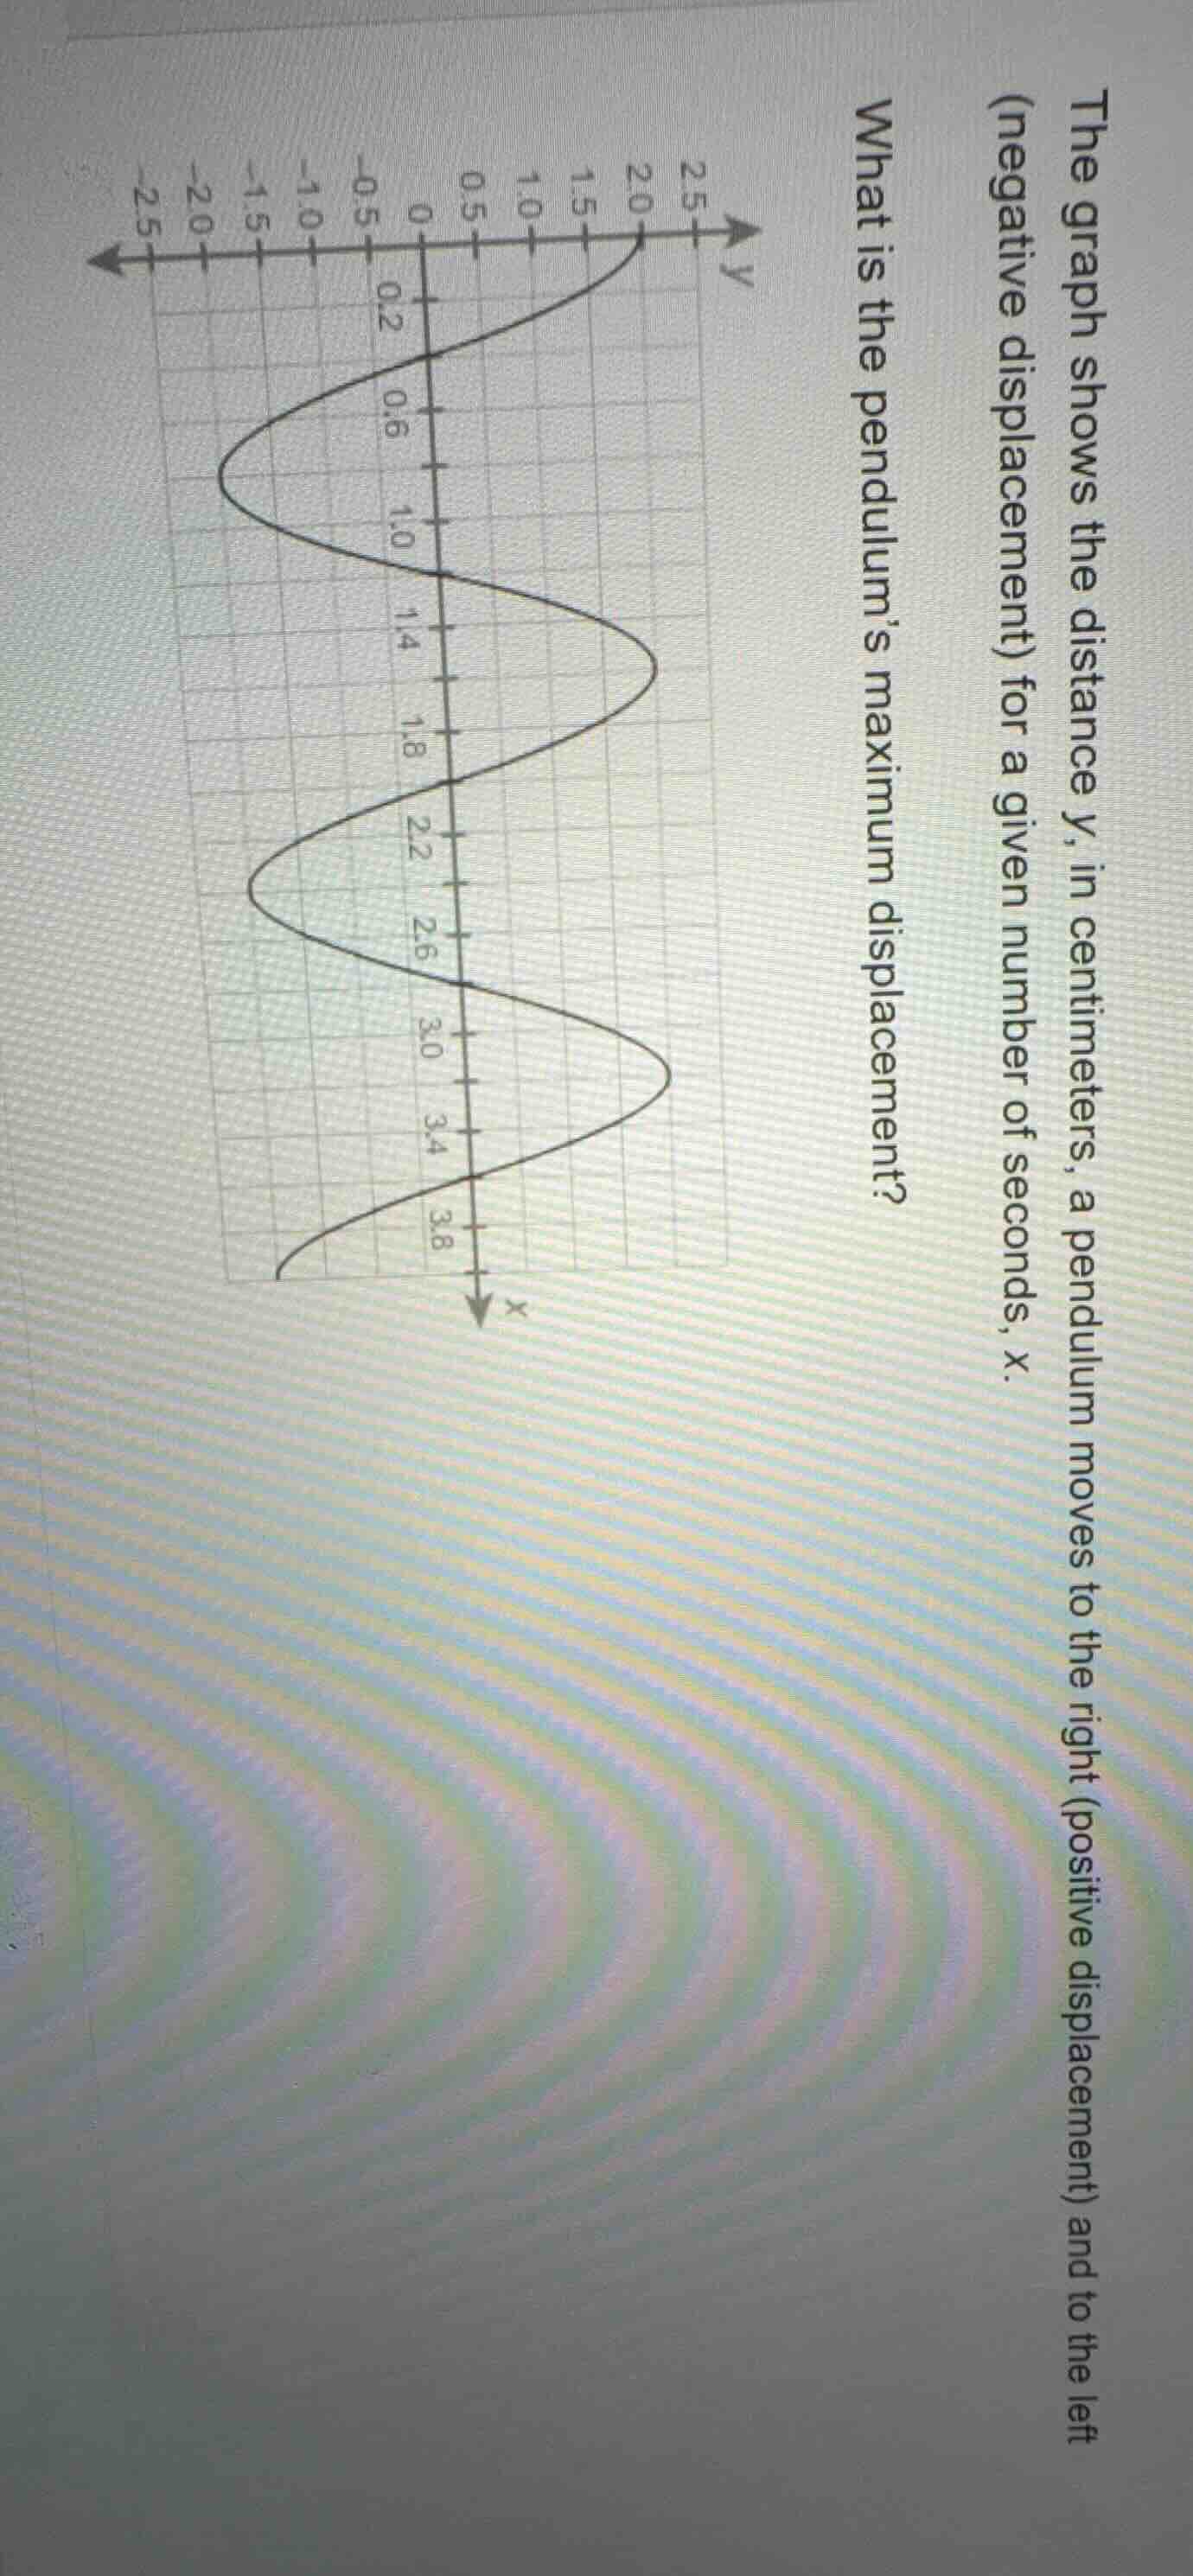
the graph shows the distance y, in centimeters, a pendulum moves to the right (positive displacement) and to the left (negative displacement) for a given number of seconds, x. what is the pendulum’s maximum displacement?
Step1: Understand the graph's meaning
The graph shows the displacement \( y \) (in cm) of a pendulum over time \( x \) (in seconds). The maximum displacement is the maximum value of \( y \) (since displacement can be positive or negative, we look for the peak in the positive or negative direction, but the maximum magnitude or the maximum positive/negative value? Here, since it's displacement, the maximum displacement is the maximum distance from the equilibrium (y=0). So we look for the highest point (maximum y) or the lowest point (minimum y) and take the absolute value, but from the graph, let's check the y - axis.
Step2: Analyze the y - axis scale
Looking at the y - axis, the grid lines: let's see the peaks. The positive peaks: when we look at the graph, the first peak (positive) is at y = 2.0? Wait, no, wait the y - axis labels: the top of the y - axis is 2.5, then 2.0, 1.5, 1.0, 0.5, 0, - 0.5, - 1.0, - 1.5, - 2.0, - 2.5. Wait, no, the graph is a wave. Wait, the negative peaks (left side) and positive peaks (right side). Wait, the maximum displacement is the amplitude, which is the maximum distance from the midline (y = 0). Let's look at the graph: the highest point (maximum y) or the lowest point (minimum y). Let's check the y - axis values. The grid lines: each major grid? Wait, the y - axis has marks at 2.5, 2.0, 1.5, 1.0, 0.5, 0, - 0.5, - 1.0, - 1.5, - 2.0, - 2.5. Wait, the graph's peaks: the positive peaks (right - side peaks) and negative peaks (left - side peaks). Let's see the first negative peak (leftmost) is at y=-2.0? Wait, no, the graph: when x is around 0.2, the graph crosses y = 0, then goes up to a peak, then down, then up, etc. Wait, the maximum displacement is the maximum value of |y|. Looking at the graph, the peaks (both positive and negative) reach up to 2.0? Wait, no, wait the y - axis: the top of the y - axis is 2.5, but the graph's positive peak is at y = 2.0? Wait, no, maybe I misread. Wait, the y - axis is labeled with 2.5 at the top, then 2.0, 1.5, 1.0, 0.5, 0, - 0.5, - 1.0, - 1.5, - 2.0, - 2.5. The graph's positive peaks (right - hand peaks) and negative peaks (left - hand peaks). Let's take the first negative peak (the leftmost peak): its y - value is - 2.0? Wait, no, the distance from y = 0 to that peak is 2.0? Wait, no, let's check the grid. Wait, the vertical grid lines: each small grid? Wait, maybe the amplitude (maximum displacement) is 2.0? Wait, no, wait the graph: when we look at the negative side (left), the peak (the lowest point? No, displacement to the left is negative, so the maximum displacement to the left is the minimum y, and to the right is maximum y. The maximum displacement is the maximum of |y|. So if the minimum y is - 2.0 and maximum y is 2.0? Wait, no, looking at the graph, the negative peaks (left - side) are at y=-2.0? Wait, the first negative peak (leftmost) is at y = - 2.0? And the positive peaks (right - side) are at y = 2.0? Wait, no, maybe the maximum displacement is 2.0? Wait, no, wait the y - axis: the label at the top is 2.5, but the graph's peaks are at 2.0? Wait, maybe I made a mistake. Wait, let's re - examine. The graph is a sinusoidal wave. The maximum displacement (amplitude) is the maximum distance from the equilibrium (y = 0). So we look for the highest point above y = 0 and the lowest point below y = 0. From the graph, the highest point above y = 0 is at y = 2.0? Wait, no, the y - axis has a mark at 2.0, and the peak reaches up to 2.0? Wait, no, the first positive peak (when x is around 2.0? No, x is the horizontal axis. Wait, x is time, y is displaceme…

Snap & solve any problem in the app
Get step-by-step solutions on Sovi AI
Photo-based solutions with guided steps
Explore more problems and detailed explanations
The pendulum's maximum displacement is \(\boldsymbol{2.0}\) centimeters (or 2 cm, depending on the graph's precision, but from the y - axis scale, the maximum displacement is 2.0 cm).