QUESTION IMAGE
Question
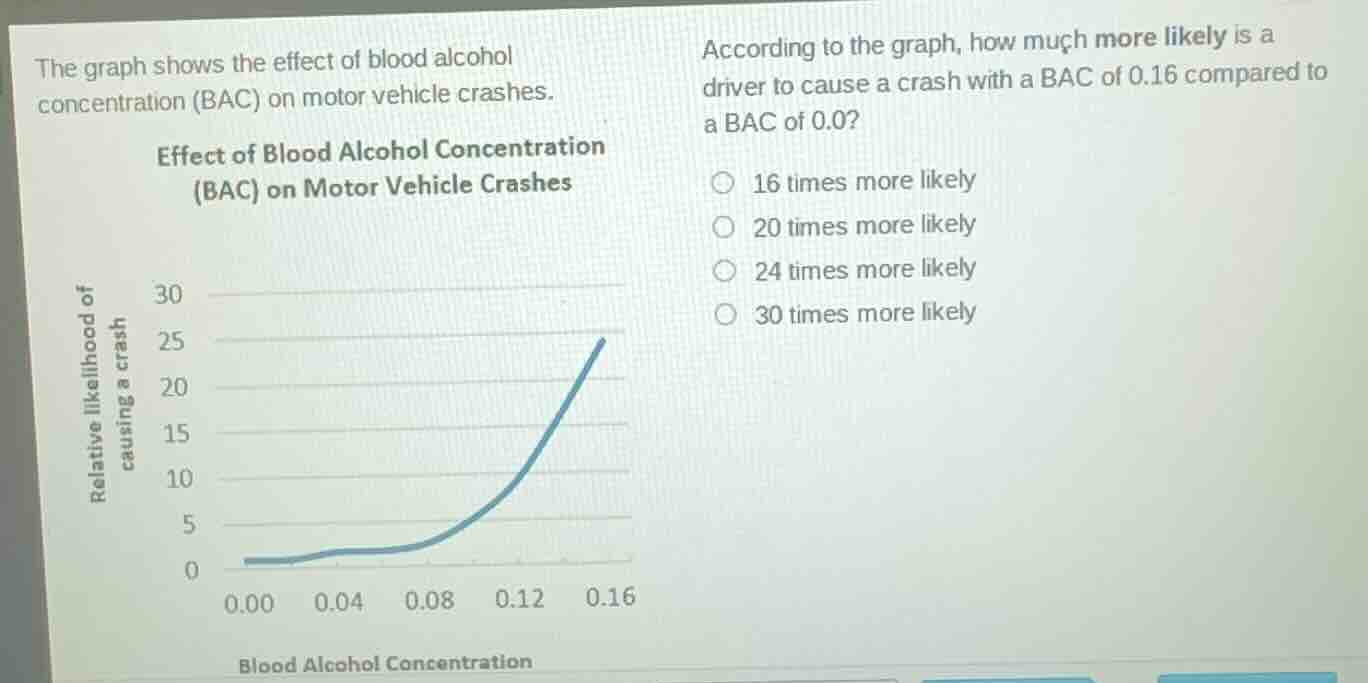
the graph shows the effect of blood alcohol concentration (bac) on motor vehicle crashes. effect of blood alcohol concentration (bac) on motor vehicle crashes. according to the graph, how much more likely is a driver to cause a crash with a bac of 0.16 compared to a bac of 0.0? 16 times more likely, 20 times more likely, 24 times more likely, 30 times more likely
Step1: Analyze the graph
The y - axis represents the relative likelihood of causing a crash, and the x - axis represents the blood alcohol concentration (BAC). For BAC = 0.00 (which is 0.0), the relative likelihood is 0 (or very close to 0, we can consider it as 1 for the purpose of comparison since we are looking at how many times more likely). For BAC = 0.16, we look at the y - value corresponding to x = 0.16 on the graph. From the graph, when BAC is 0.16, the relative likelihood of causing a crash is 24 (by reading the y - axis value at x = 0.16).
Step2: Determine the multiple
To find how many times more likely a driver with BAC 0.16 is to cause a crash compared to BAC 0.0, we divide the likelihood at BAC 0.16 by the likelihood at BAC 0.0. Since the likelihood at BAC 0.0 is 1 (base case), and at BAC 0.16 it is 24, the driver with BAC 0.16 is 24 times more likely.

Snap & solve any problem in the app
Get step-by-step solutions on Sovi AI
Photo-based solutions with guided steps
Explore more problems and detailed explanations
24 times more likely