QUESTION IMAGE
Question
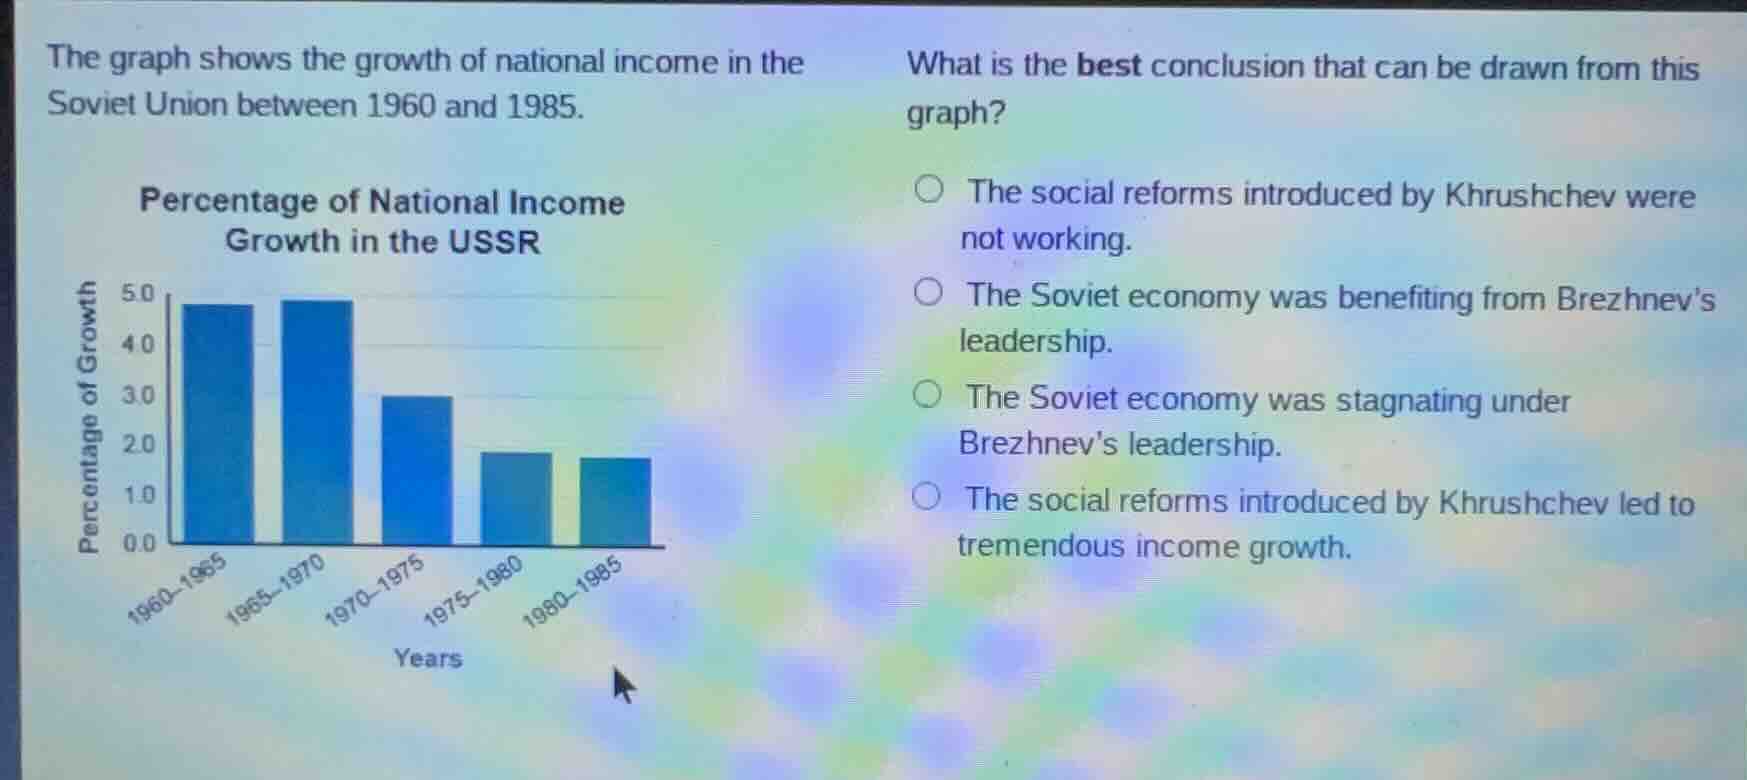
the graph shows the growth of national income in the soviet union between 1960 and 1985. percentage of national income growth in the ussr years 1960 - 1965, 1965 - 1970, 1970 - 1975, 1975 - 1980, 1980 - 1985, percentage of growth from 0.0 to 5.0. what is the best conclusion that can be drawn from this graph? the social reforms introduced by khrushchev were not working. the soviet economy was benefiting from brezhnevs leadership. the soviet economy was stagnating under brezhnevs leadership. the social reforms introduced by khrushchev led to tremendous income growth.
- Analyze Option 1: Khrushchev was in power until around 1964. The graph's first two periods (1960 - 1965, 1965 - 1970) show relatively high growth, so saying his reforms weren't working is incorrect.
- Analyze Option 2: Brezhnev led from mid - 1960s to 1982. The graph shows a decline in national income growth from 1970 - 1975, 1975 - 1980, and 1980 - 1985. So the economy was not benefiting from his leadership in terms of growth, this option is wrong.
- Analyze Option 3: During Brezhnev's leadership (post - 1965, especially from 1970 onwards), the percentage of national income growth is decreasing (from around 5% to below 2%). This indicates stagnation as growth is slowing down or remaining low.
- Analyze Option 4: The first two periods (1960 - 1965, 1965 - 1970) have high growth, but "tremendous" is an overstatement, and also the later periods under Brezhnev show decline, so this option is incorrect.

Snap & solve any problem in the app
Get step-by-step solutions on Sovi AI
Photo-based solutions with guided steps
Explore more problems and detailed explanations
C. The Soviet economy was stagnating under Brezhnev’s leadership.