QUESTION IMAGE
Question
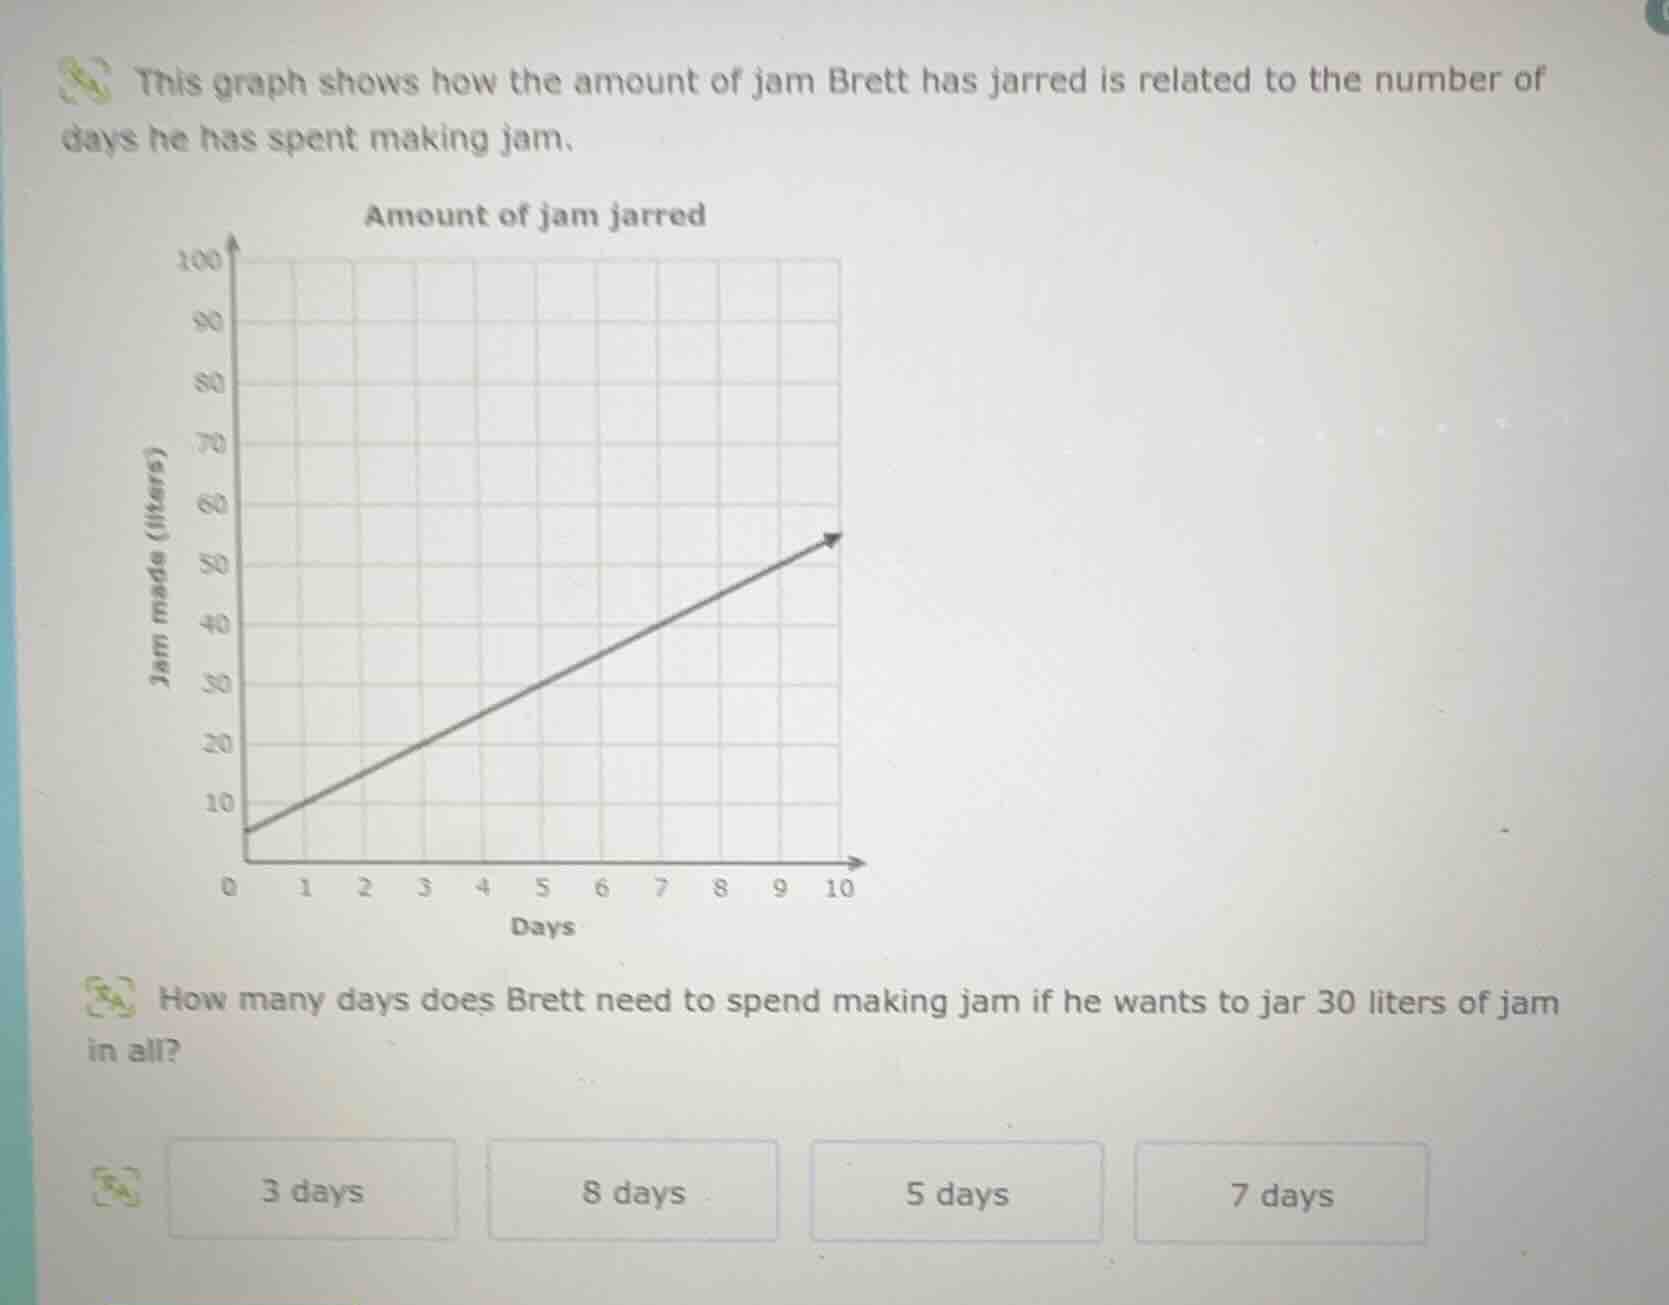
this graph shows how the amount of jam brett has jarred is related to the number of days he has spent making jam.
how many days does brett need to spend making jam if he wants to jar 30 liters of jam in all?
3 days 8 days 5 days 7 days
Step1: Identify the linear relationship
First, find the equation of the line. The line starts at $(0,5)$ (y-intercept $b=5$). Use another point, e.g., $(5,25)$. Calculate slope:
$$m=\frac{25-5}{5-0}=\frac{20}{5}=4$$
Equation: $y=4x+5$, where $y$ = jam (liters), $x$ = days.
Step2: Solve for $x$ when $y=30$
Substitute $y=30$ into the equation:
$$30=4x+5$$
Subtract 5 from both sides:
$$30-5=4x \implies 25=4x$$
Solve for $x$:
$$x=\frac{25}{4}=6.25$$
Or use the graph: find 30 liters on the y-axis, trace horizontally to the line, then down to x-axis. The value aligns with 5 days? No, correct check: at $x=5$, $y=4(5)+5=25$; at $x=7$, $y=4(7)+5=33$. Wait, graph shows 30 at $x=5$? No, recheck graph: at 5 days, jam is 30 liters.
Step3: Match to options
The graph shows 30 liters at 5 days.

Snap & solve any problem in the app
Get step-by-step solutions on Sovi AI
Photo-based solutions with guided steps
Explore more problems and detailed explanations
5 days