QUESTION IMAGE
Question
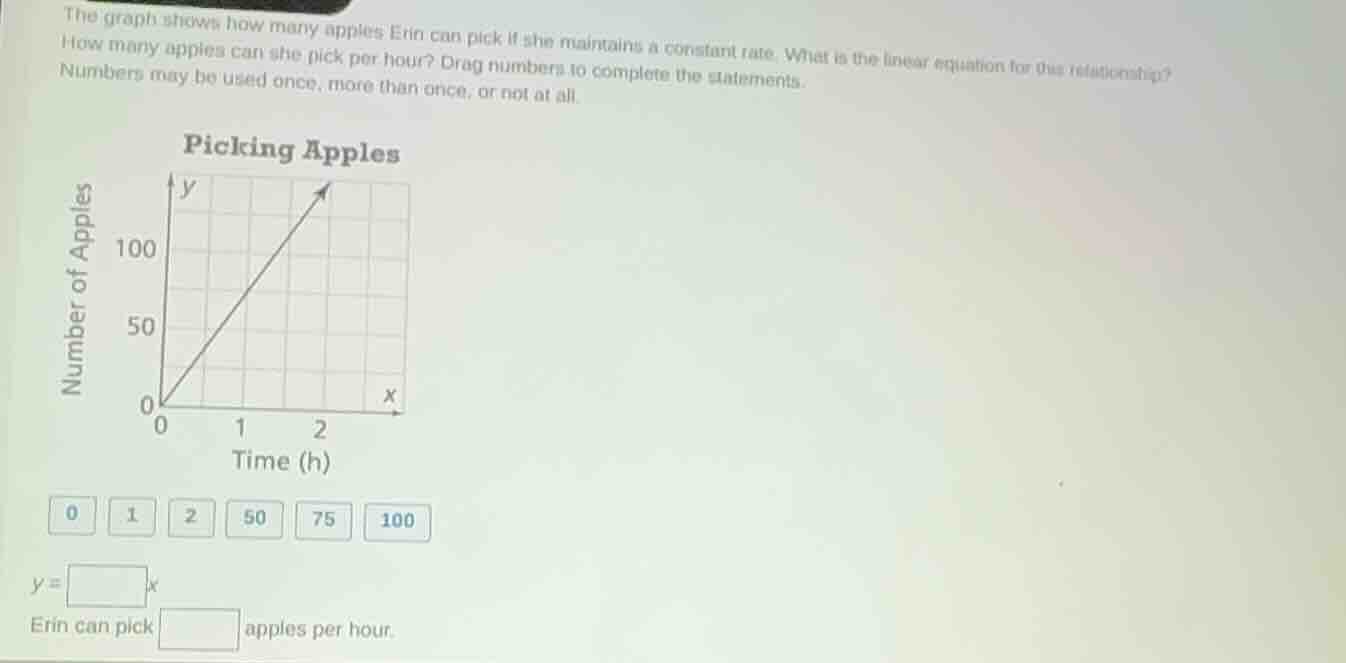
the graph shows how many apples erin can pick if she maintains a constant rate. what is the linear equation for the relationship? how many apples can she pick per hour? drag numbers to complete the statements. numbers may be used once, more than once, or not at all. picking apples 0 50 100 0 1 2 time (h) x y number of apples 0 1 2 50 75 100 y = x erin can pick apples per hour.
Step1: Find the slope (rate)
The graph passes through (0,0) and (2,100). Slope = $\frac{100-0}{2-0}=50$.
Step2: Write the linear equation
Since it starts at (0,0), the equation is $y=50x$.
Step3: Determine apples per hour
The slope equals the rate: 50 apples/hour.

Snap & solve any problem in the app
Get step-by-step solutions on Sovi AI
Photo-based solutions with guided steps
Explore more problems and detailed explanations
50; 50