QUESTION IMAGE
Question
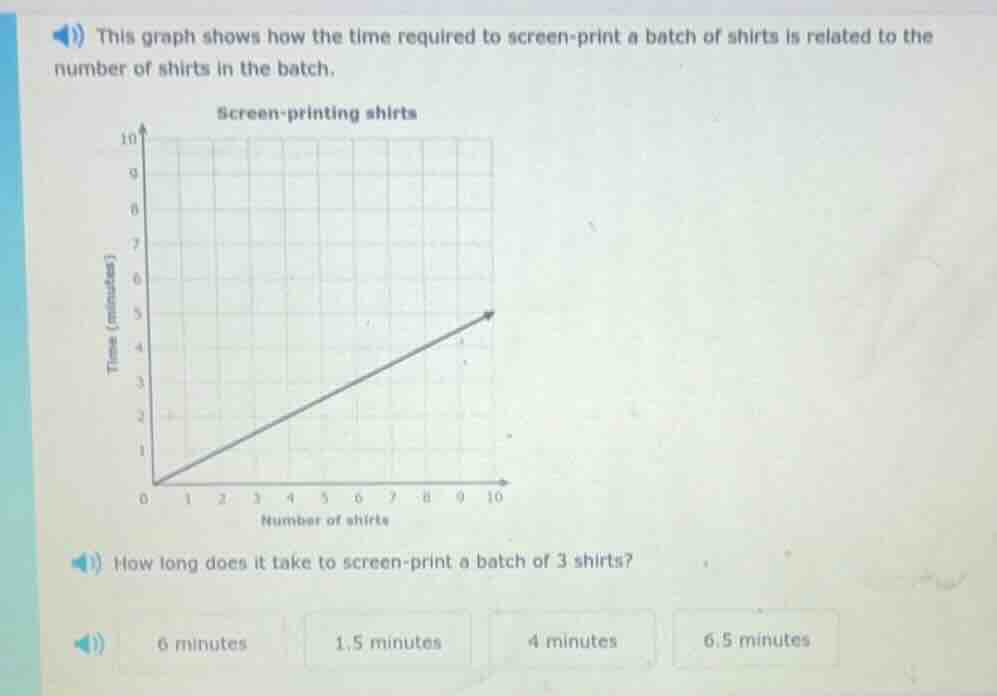
this graph shows how the time required to screen - print a batch of shirts is related to the number of shirts in the batch. screen - printing shirts (graph: x - axis: number of shirts, y - axis: time (minutes), line from (0,0) to (10,5)) how long does it take to screen - print a batch of 3 shirts? options: 6 minutes, 1.5 minutes, 4 minutes, 6.5 minutes
Step1: Analyze the graph's slope
The graph is a straight line through the origin, so it's a proportional relationship. Let's find the slope (rate). For 10 shirts, time is 5 minutes, so slope $m = \frac{5}{10} = 0.5$ minutes per shirt.
Step2: Calculate time for 3 shirts
Using the formula $y = mx$ (where $y$ is time, $x$ is number of shirts), for $x = 3$, $y = 0.5\times3 = 1.5$ minutes. Alternatively, we can look at the grid: at $x = 3$ (number of shirts), the y - value (time) on the line is 1.5 minutes.

Snap & solve any problem in the app
Get step-by-step solutions on Sovi AI
Photo-based solutions with guided steps
Explore more problems and detailed explanations
1.5 minutes