QUESTION IMAGE
Question
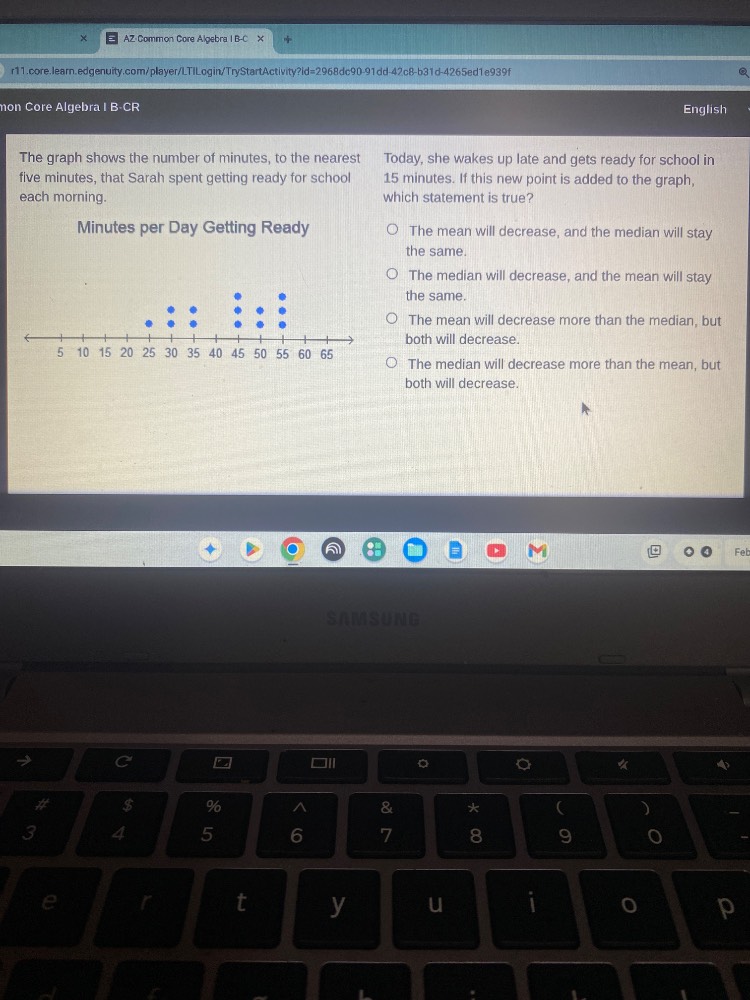
the graph shows the number of minutes, to the nearest five minutes, that sarah spent getting ready for school each morning.
minutes per day getting ready
today, she wakes up late and gets ready for school in 15 minutes. if this new point is added to the graph, which statement is true?
○ the mean will decrease, and the median will stay the same.
○ the median will decrease, and the mean will stay the same.
○ the mean will decrease more than the median, but both will decrease.
○ the median will decrease more than the mean, but both will decrease.
Step1: List original data values
From the dot plot, the data (minutes) is: 25, 25, 30, 30, 30, 35, 35, 45, 45, 45, 45, 50, 50, 50, 55, 55, 55
Count: $n=17$
Step2: Calculate original mean and median
Mean:
$\text{Mean} = \frac{25+25+30+30+30+35+35+45+45+45+45+50+50+50+55+55+55}{17}$
$\text{Mean} = \frac{740}{17} \approx 43.53$
Median:
For $n=17$, median is the 9th value: $45$
Step3: Add new data point (15)
New data set: 15, 25, 25, 30, 30, 30, 35, 35, 45, 45, 45, 45, 50, 50, 50, 55, 55, 55
New count: $n=18$
Step4: Calculate new mean and median
Mean:
$\text{New Mean} = \frac{740 + 15}{18} = \frac{755}{18} \approx 41.94$
Median:
For $n=18$, median is average of 9th and 10th values: $\frac{45 + 45}{2} = 45$
Step5: Compare changes
Mean decreased ($43.53 \to 41.94$), median stayed the same ($45 \to 45$)

Snap & solve any problem in the app
Get step-by-step solutions on Sovi AI
Photo-based solutions with guided steps
Explore more problems and detailed explanations
The mean will decrease, and the median will stay the same.