QUESTION IMAGE
Question
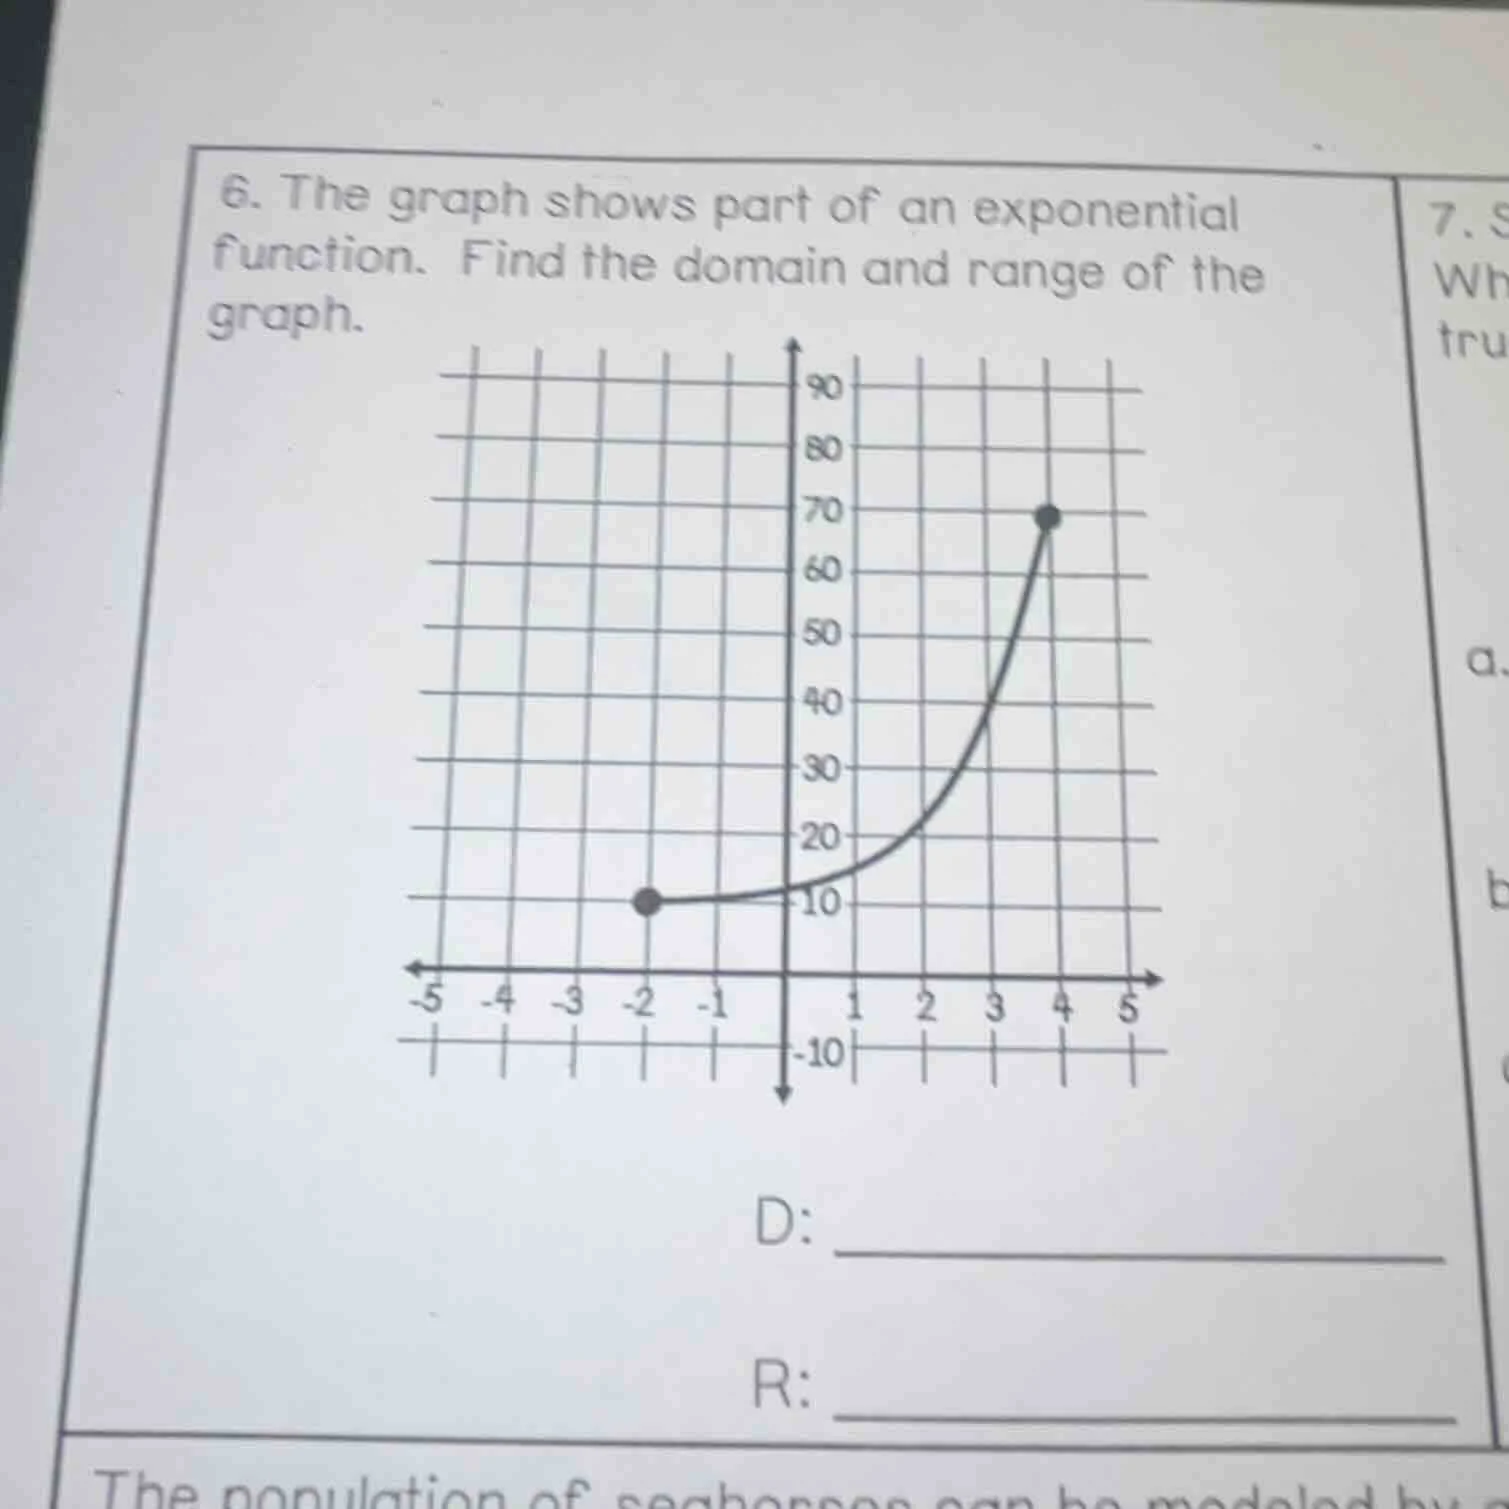
- the graph shows part of an exponential function. find the domain and range of the graph.
Step1: Determine the domain
The domain of a function is the set of all possible x - values (input values) for which the function is defined. From the graph, we can see that the leftmost point has an x - value of - 2 and the rightmost point has an x - value of 4. Also, the graph is a continuous curve between these two x - values. So, the domain is the set of all real numbers from - 2 to 4, inclusive. In interval notation, this is $[-2,4]$.
Step2: Determine the range
The range of a function is the set of all possible y - values (output values) that the function can take. Looking at the graph, the lowest y - value (the y - coordinate of the leftmost point) is 10, and the highest y - value (the y - coordinate of the rightmost point) is 70. The graph is an exponential curve that is increasing (since it's an exponential function and the curve is rising from left to right in this interval) between these two y - values. So, the range is the set of all real numbers from 10 to 70, inclusive. In interval notation, this is $[10,70]$.

Snap & solve any problem in the app
Get step-by-step solutions on Sovi AI
Photo-based solutions with guided steps
Explore more problems and detailed explanations
Domain: $[-2, 4]$, Range: $[10, 70]$