QUESTION IMAGE
Question
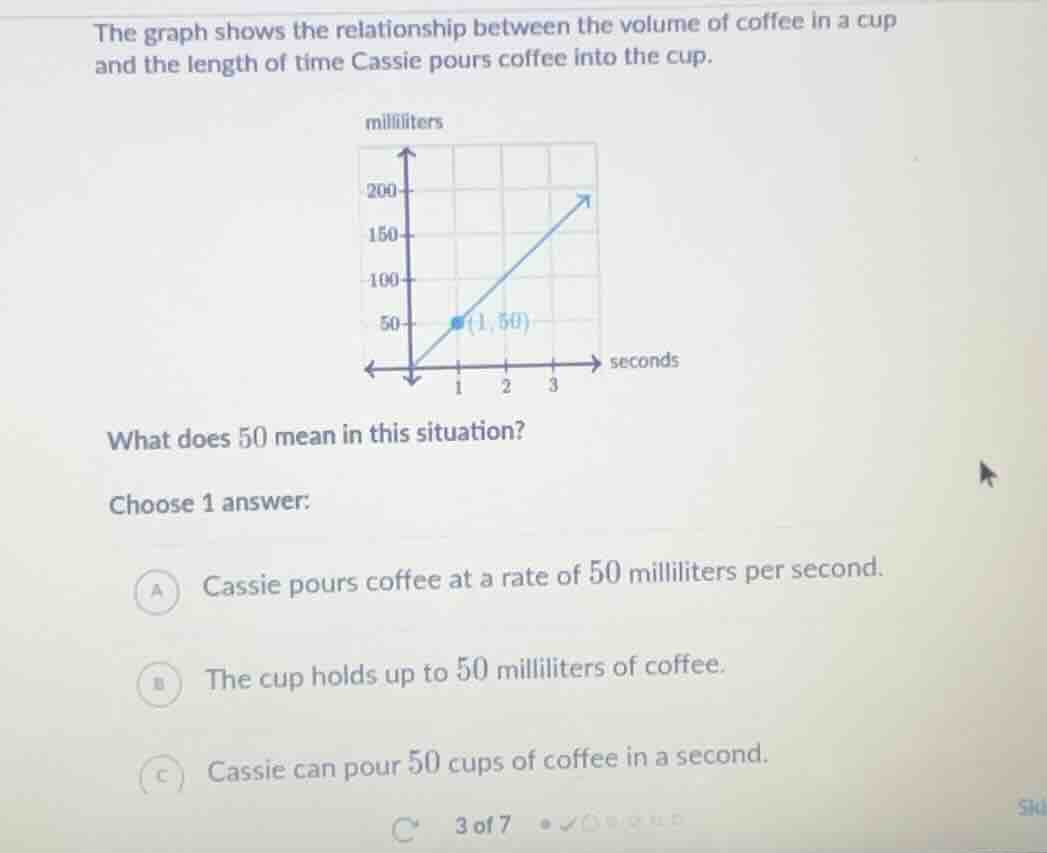
the graph shows the relationship between the volume of coffee in a cup and the length of time cassie pours coffee into the cup.
what does 50 mean in this situation?
choose 1 answer:
a cassie pours coffee at a rate of 50 milliliters per second.
b the cup holds up to 50 milliliters of coffee.
c cassie can pour 50 cups of coffee in a second.
The point (1, 50) means at 1 second, the volume of coffee is 50 milliliters. This represents the rate of pouring, as it's volume per unit time. Option B is wrong because the graph goes to 200 mL, so the cup holds more. Option C is irrelevant to the volume-time relationship.

Snap & solve any problem in the app
Get step-by-step solutions on Sovi AI
Photo-based solutions with guided steps
Explore more problems and detailed explanations
A. Cassie pours coffee at a rate of 50 milliliters per second.