QUESTION IMAGE
Question
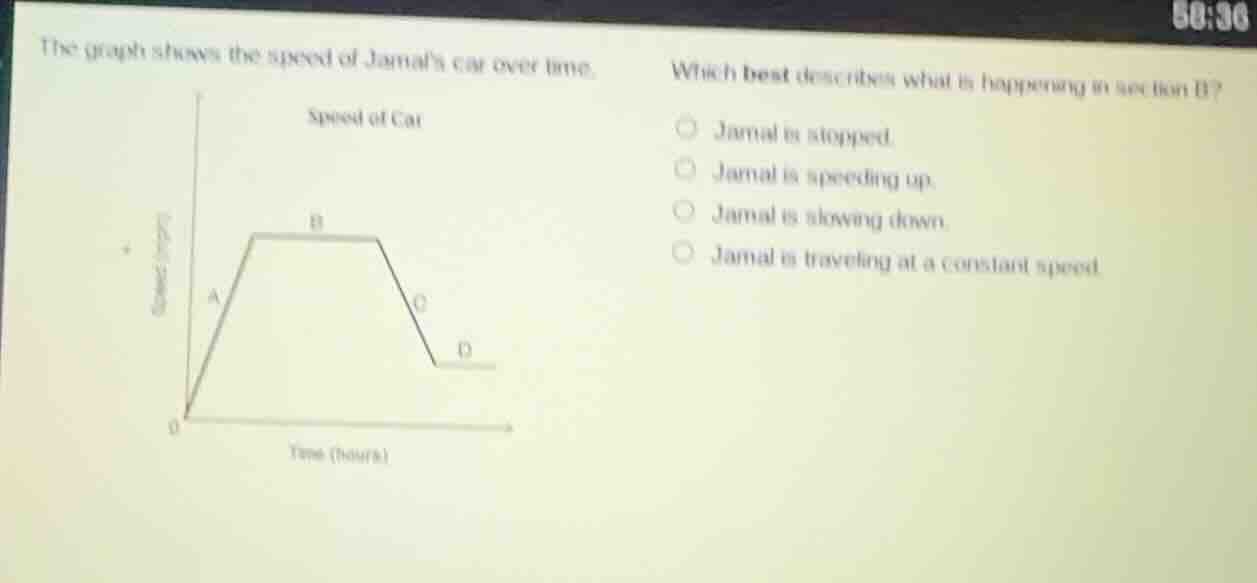
the graph shows the speed of jamals car over time.which best describes what is happening in section b?jamal is stopped.jamal is speeding up.jamal is slowing down.jamal is traveling at a constant speed.
Brief Explanations
A speed-time graph with a horizontal line (section B) means speed does not change as time increases. This corresponds to moving at a steady, unchanging speed.

Snap & solve any problem in the app
Get step-by-step solutions on Sovi AI
Photo-based solutions with guided steps
Explore more problems and detailed explanations
D. Jamal is traveling at a constant speed.