QUESTION IMAGE
Question
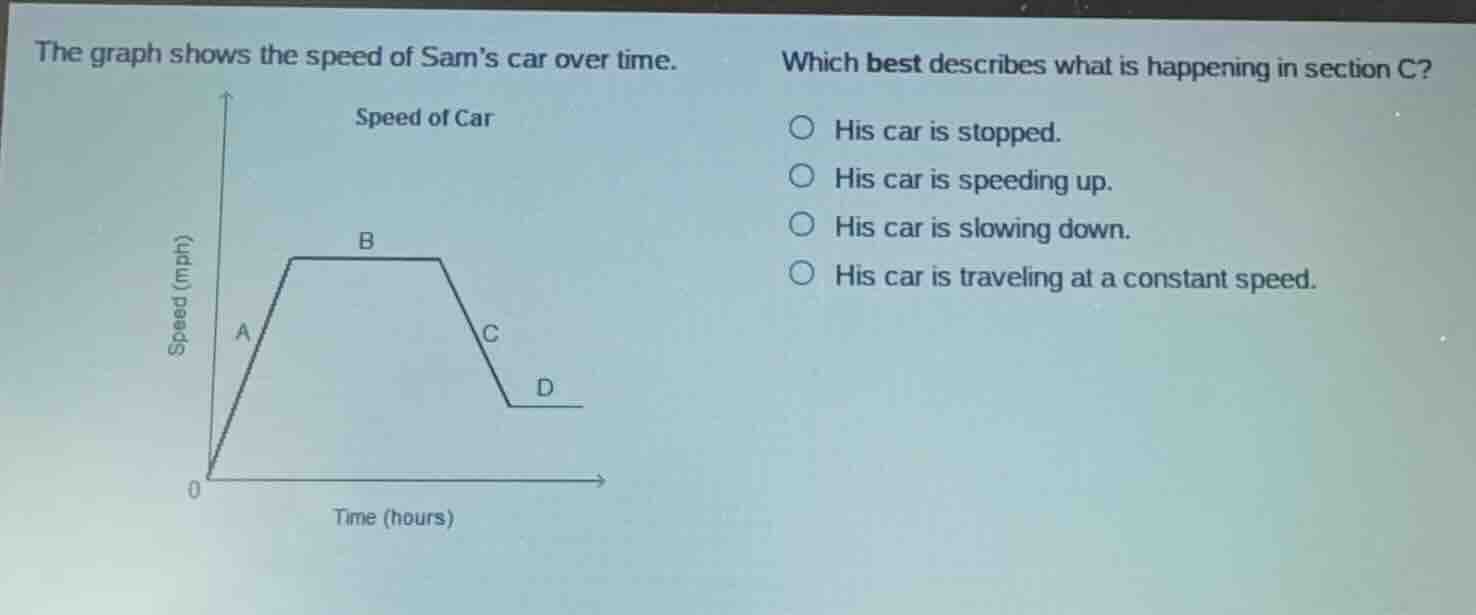
the graph shows the speed of sams car over time.
which best describes what is happening in section c?
○ his car is stopped.
○ his car is speeding up.
○ his car is slowing down.
○ his car is traveling at a constant speed.
Brief Explanations
Section C of the speed-time graph shows speed decreasing as time increases, which means the car's speed is reducing (slowing down). A flat line would mean constant speed, a rising line would mean speeding up, and a line at 0 speed would mean stopped.

Snap & solve any problem in the app
Get step-by-step solutions on Sovi AI
Photo-based solutions with guided steps
Explore more problems and detailed explanations
C. His car is slowing down.