QUESTION IMAGE
Question
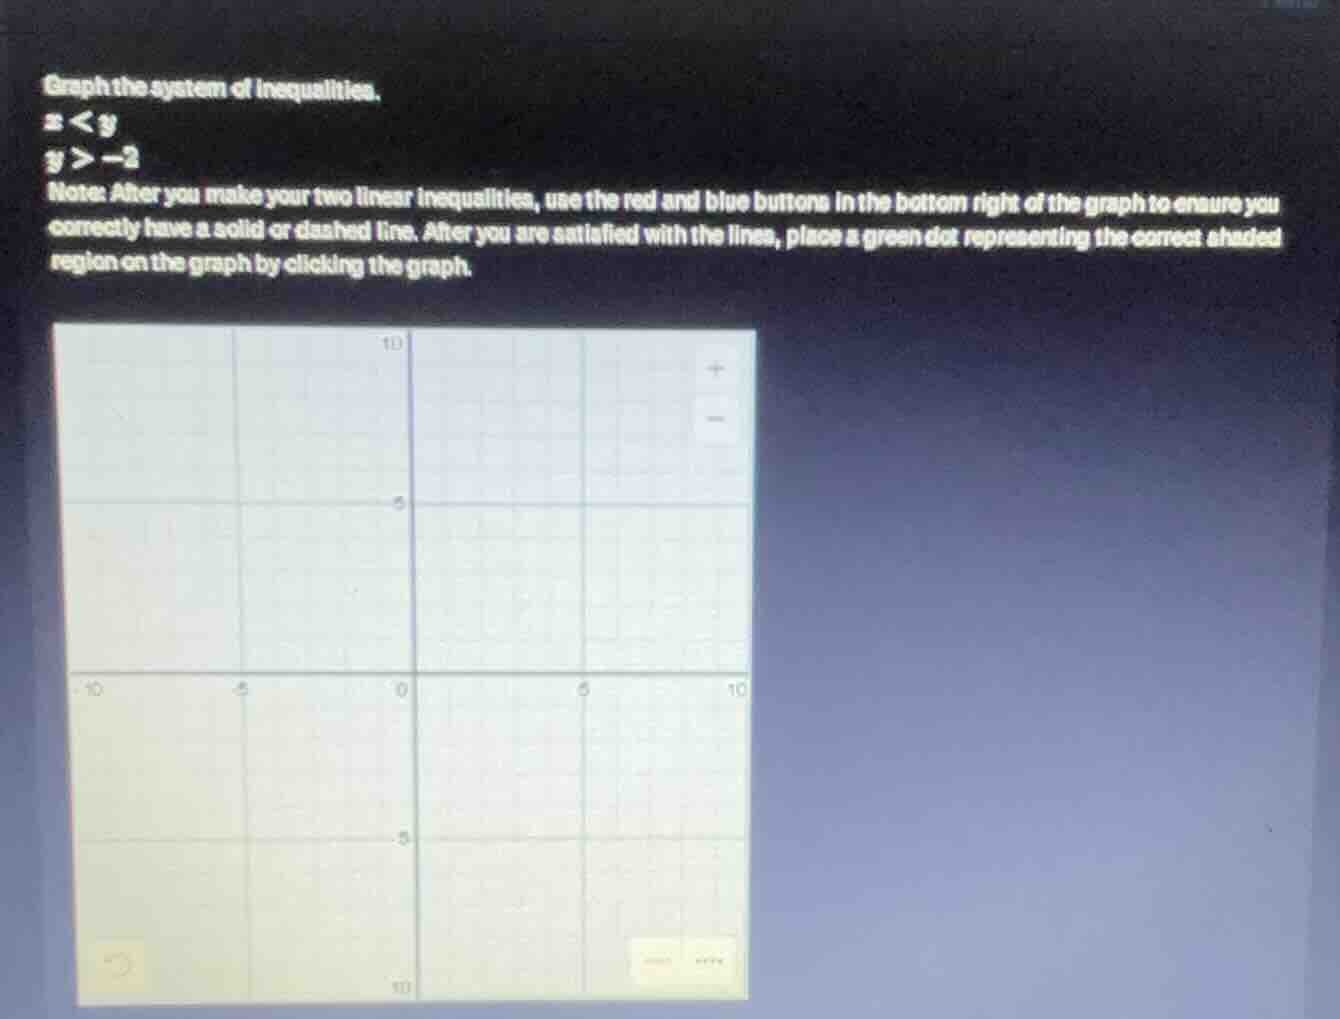
graph the system of inequalities.
x < y
y > -2
note: after you make your two linear inequalities, use the red and blue buttons in the bottom right of the graph to ensure you correctly have a solid or dashed line. after you are satisfied with the lines, place a green dot representing the correct shaded region on the graph by clicking the graph.
Step1: Graph boundary for $x
First, identify the boundary line $y=x$. Since the inequality is $<$ (strict), use a dashed line. This line passes through points like $(0,0)$, $(1,1)$, $(-1,-1)$.
Step2: Shade region for $x
The inequality $xx$, so shade the region above the dashed line $y=x$.
Step3: Graph boundary for $y>-2$
Identify the boundary line $y=-2$, a horizontal line. Since the inequality is $>$ (strict), use a dashed line at $y=-2$.
Step4: Shade region for $y>-2$
Shade the region above the dashed line $y=-2$.
Step5: Find overlapping region
The solution is the area that is shaded in both regions: above $y=-2$ and above $y=x$. A sample point in this region is $(0,1)$ (it satisfies both $0<1$ and $1>-2$). Place the green dot in this overlapping area.
The inequality $x
Step3: Graph boundary for $y>-2$
Identify the boundary line $y=-2$, a horizontal line. Since the inequality is $>$ (strict), use a dashed line at $y=-2$.
Step4: Shade region for $y>-2$
Shade the region above the dashed line $y=-2$.
Step5: Find overlapping region
The solution is the area that is shaded in both regions: above $y=-2$ and above $y=x$. A sample point in this region is $(0,1)$ (it satisfies both $0<1$ and $1>-2$). Place the green dot in this overlapping area.

Snap & solve any problem in the app
Get step-by-step solutions on Sovi AI
Photo-based solutions with guided steps
Explore more problems and detailed explanations
- Draw a dashed line for $y=x$ (passing through $(0,0)$, $(1,1)$).
- Draw a dashed horizontal line for $y=-2$.
- Shade (and place the green dot in) the region that is above both dashed lines (e.g., at the point $(0,1)$).