QUESTION IMAGE
Question
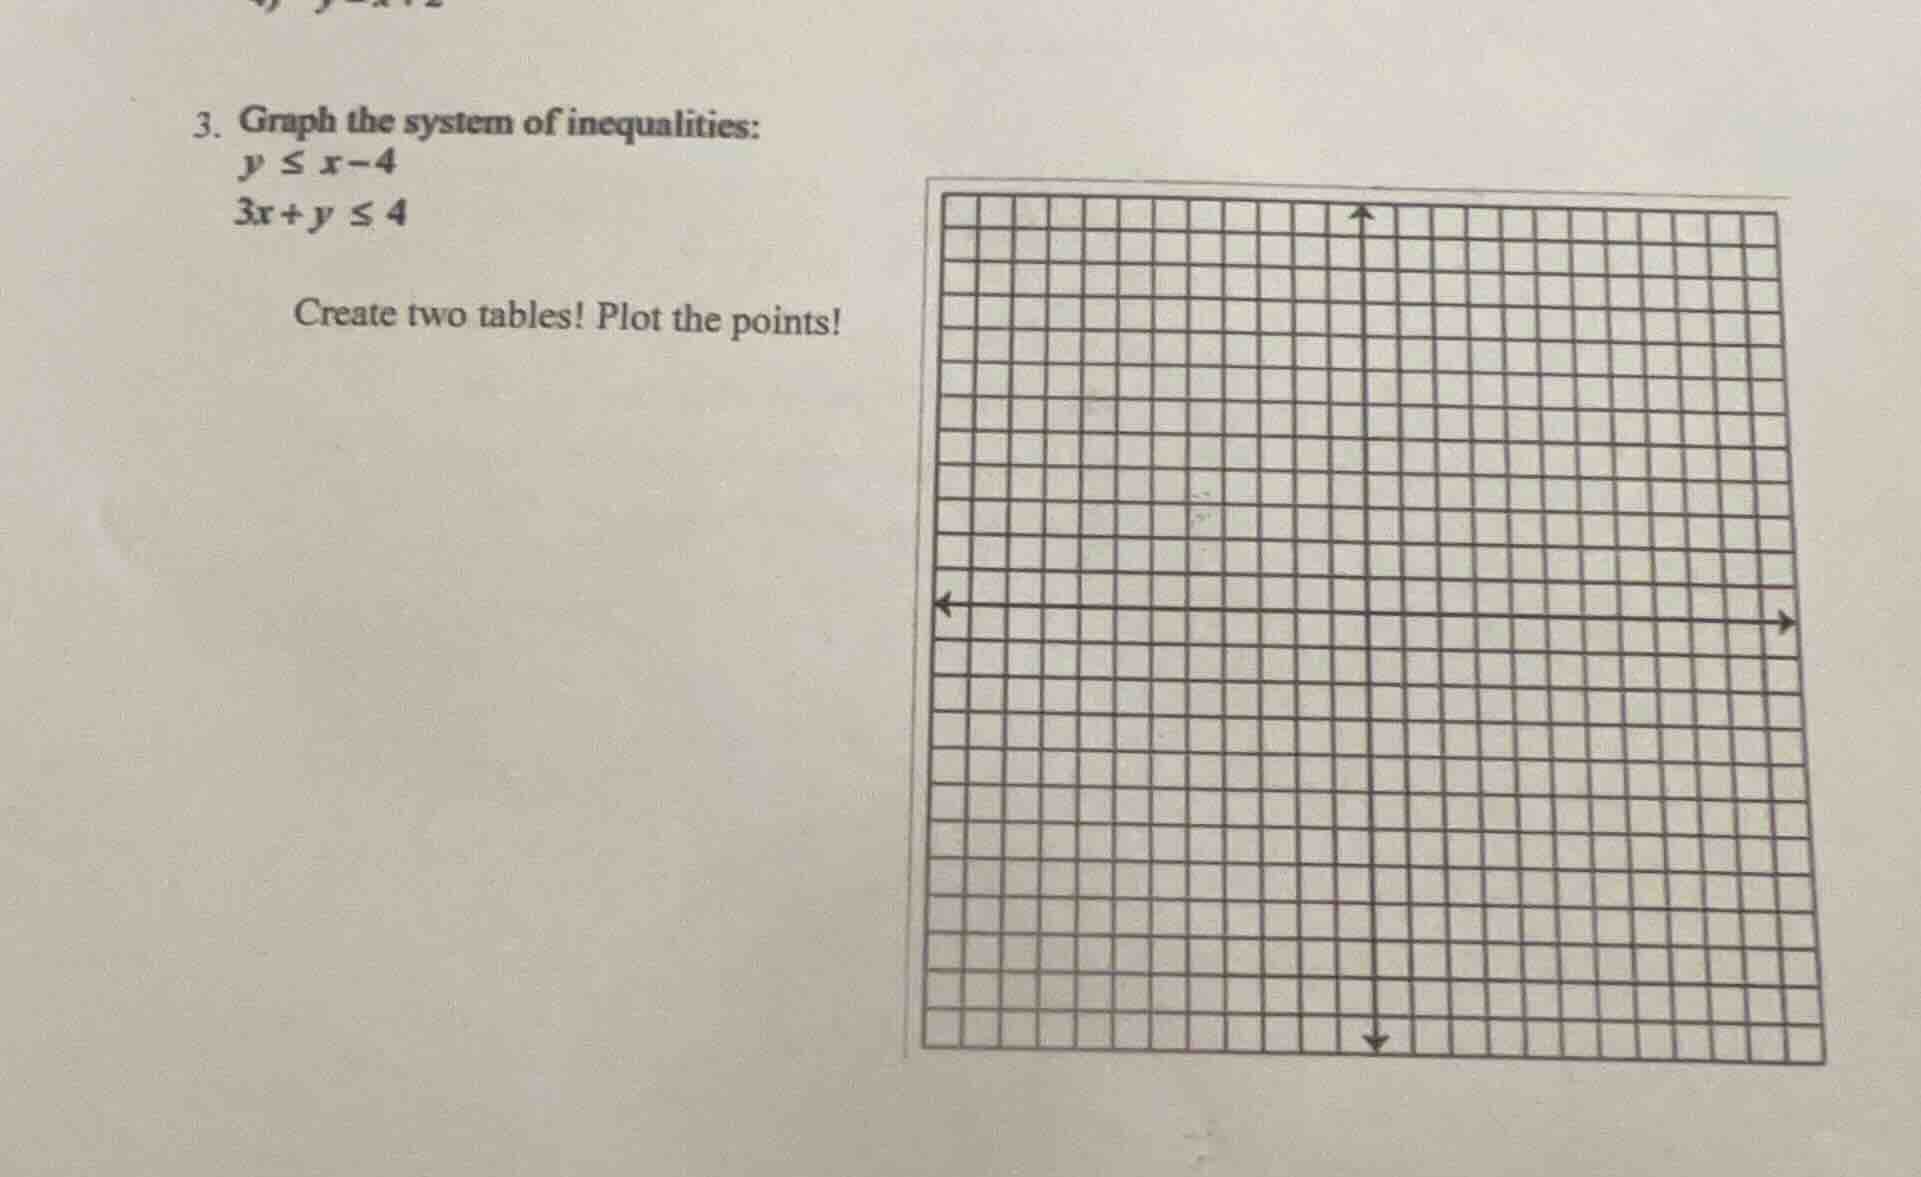
- graph the system of inequalities:
y ≤ x - 4
3x + y ≤ 4
create two tables! plot the points!
for \( y \leq x - 4 \):
Step 1: Rewrite as equation
First, consider the boundary line \( y = x - 4 \) (a linear equation in slope - intercept form \( y=mx + b \), where \( m = 1 \) and \( b=-4 \)).
Step 2: Create a table of values
We can choose some values for \( x \) and calculate the corresponding \( y \) values.
| \( x \) | \( y=x - 4 \) |
|---|---|
| \( 4 \) | \( y = 4-4 = 0 \) |
| \( 5 \) | \( y=5 - 4 = 1 \) |
Since the inequality is \( y\leq x - 4 \), the line will be solid (because of the "less than or equal to" sign), and we will shade the region below the line. To test the region, we can use a test point, for example, the point \( (0,0) \). Substitute into the inequality: \( 0\leq0 - 4\)? \( 0\leq - 4\) is false, so we shade the region that does not contain \( (0,0) \), which is below the line \( y=x - 4 \).
for \( 3x + y\leq4 \):
Step 1: Rewrite as equation
Rewrite the inequality \( 3x + y\leq4 \) as the equation \( y=-3x + 4 \) (slope - intercept form, where \( m=-3 \) and \( b = 4 \)).
Step 2: Create a table of values
Choose values for \( x \) and find \( y \):
| \( x \) | \( y=-3x + 4 \) |
|---|---|
| \( 1 \) | \( y=-3(1)+4 = 1 \) |
| \( 2 \) | \( y=-3(2)+4=-2 \) |
The boundary line is solid (because of the "less than or equal to" sign). Use a test point, say \( (0,0) \). Substitute into the inequality: \( 3(0)+0\leq4 \)? \( 0\leq4 \) is true. So we shade the region that contains \( (0,0) \), which is below the line \( y = - 3x+4 \).
Plotting the Points:
- For the line \( y=x - 4 \), plot the points from its table (\( (0,-4) \), \( (4,0) \), \( (5,1) \)) and draw a solid line through them. Then shade the region below the line.
- For the line \( 3x + y=4 \) (or \( y=-3x + 4 \)), plot the points from its table (\( (0,4) \), \( (1,1) \), \( (2,-2) \)) and draw a solid line through them. Then shade the region below the line.
The solution to the system of inequalities is the region where the two shaded regions overlap.

Snap & solve any problem in the app
Get step-by-step solutions on Sovi AI
Photo-based solutions with guided steps
Explore more problems and detailed explanations
To graph the system:
- For \( y\leq x - 4 \):
- Draw the solid line \( y = x-4 \) using the points from its table.
- Shade the region below the line.
- For \( 3x + y\leq4 \):
- Draw the solid line \( y=-3x + 4 \) using the points from its table.
- Shade the region below the line.
The overlapping shaded region (and the two solid lines) represents the solution to the system of inequalities. The tables are:
For \( y\leq x - 4 \):
| \( x \) | \( y=x - 4 \) |
|---|---|
| \( 4 \) | \( 0 \) |
| \( 5 \) | \( 1 \) |
For \( 3x + y\leq4 \):
| \( x \) | \( y=-3x + 4 \) |
|---|---|
| \( 1 \) | \( 1 \) |
| \( 2 \) | \( -2 \) |
(The final graph will have two solid lines and a shaded region of overlap. Since the question asks to graph, the key steps are creating the tables, plotting the points, drawing the lines, and shading the appropriate regions.)