QUESTION IMAGE
Question
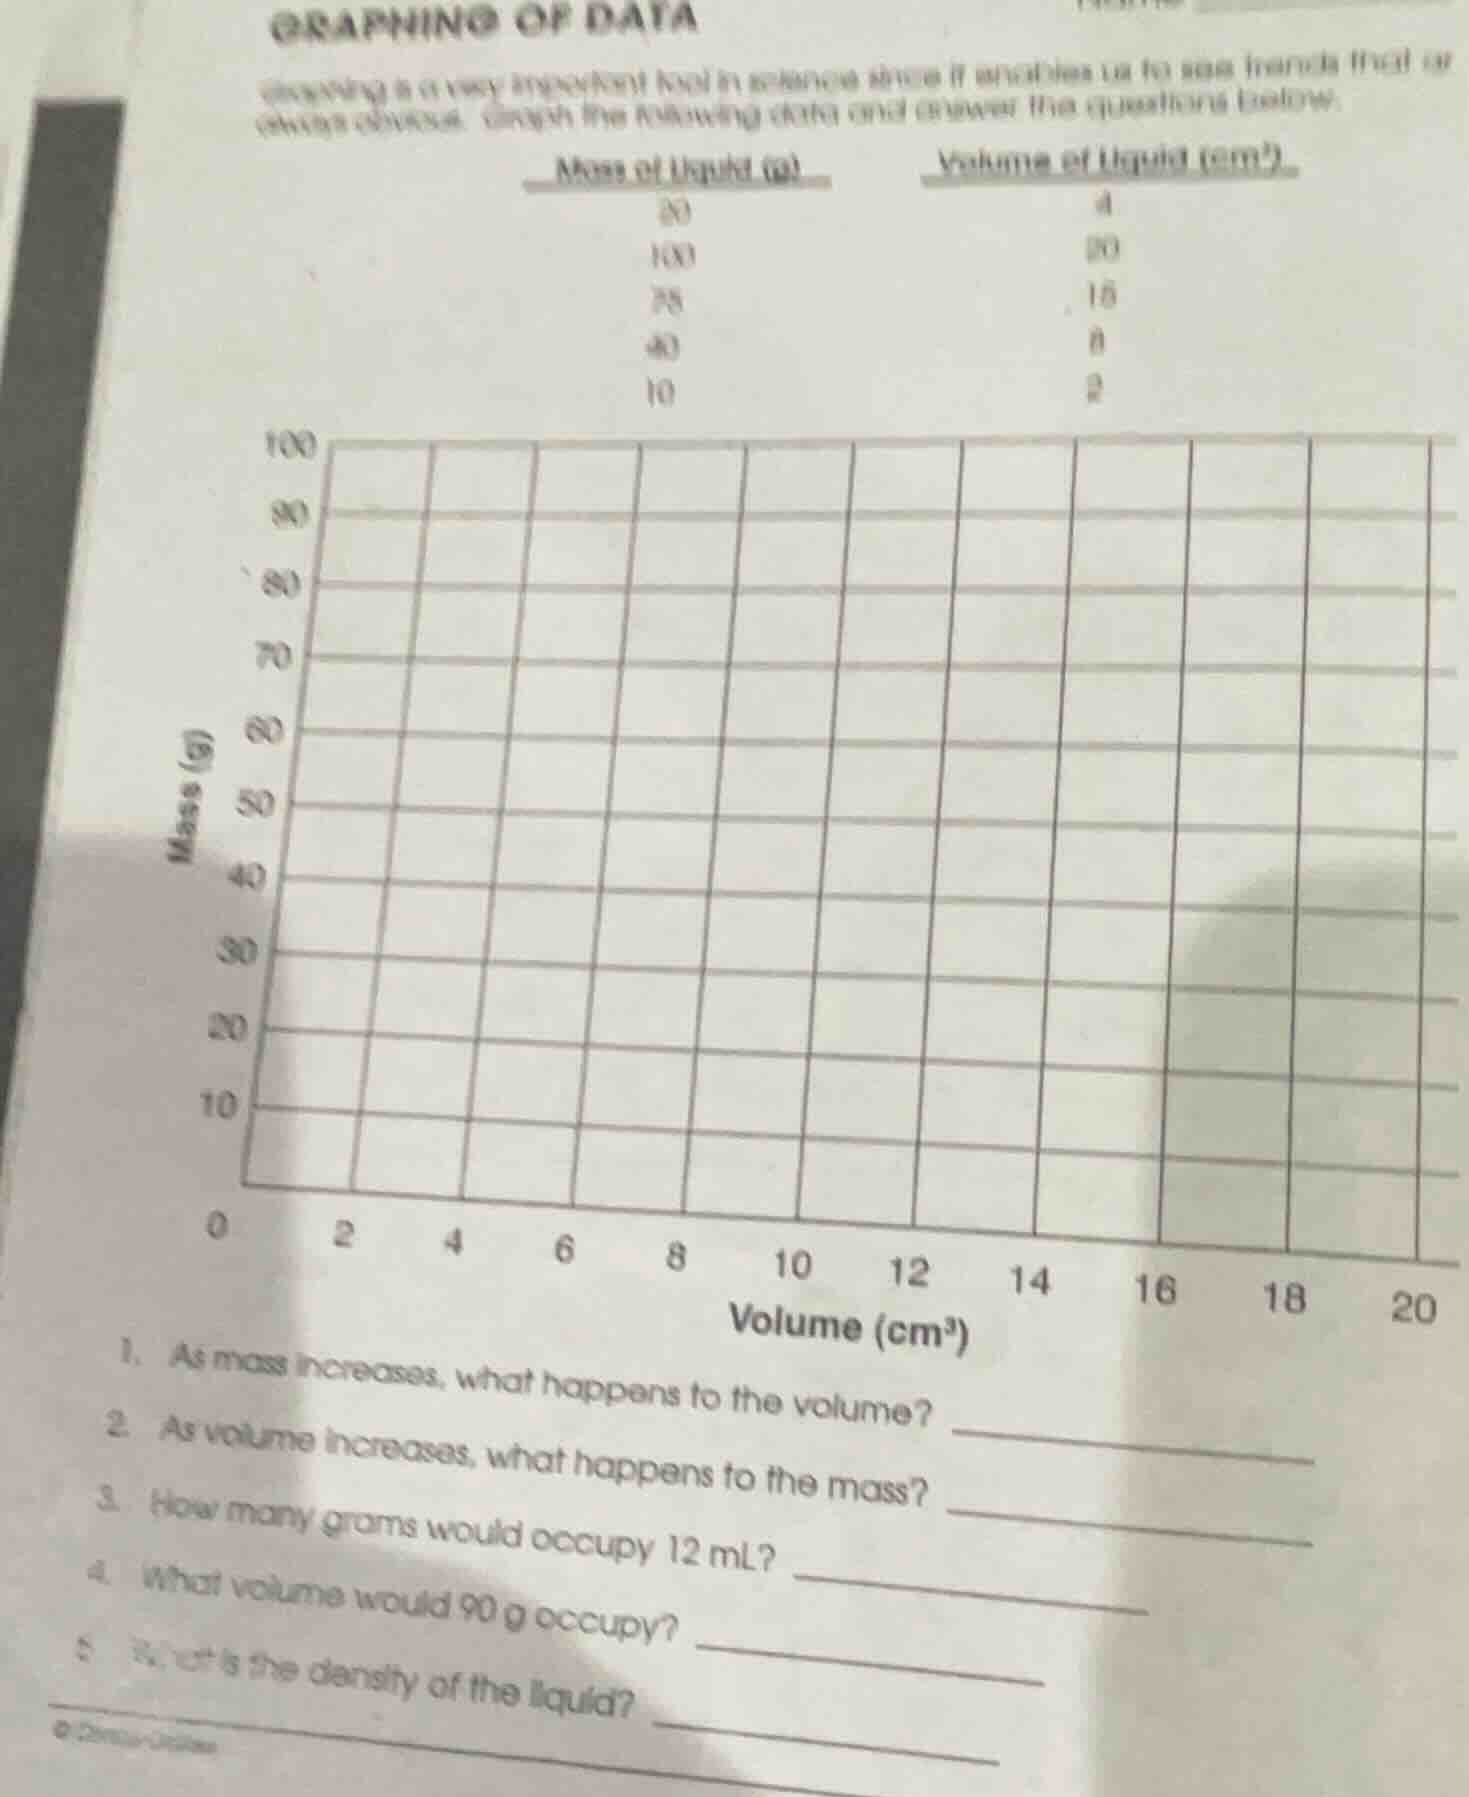
graphing of data
graphing is a very important tool in science since it enables us to see trends that or
show converse. using the following data and answer the questions below.
mass of liquid (g) volume of liquid (cm³)
80 4
100 20
75 15
40 8
10 2
- as mass increases, what happens to the volume?
- as volume increases, what happens to the mass?
- how many grams would occupy 12 ml?
- what volume would 90 g occupy?
- what is the density of the liquid?
Question 1
We analyze the given data (mass vs. volume). As mass values (10, 40, 75, 100, 80) increase, volume values (2, 8, 15, 20, 4) also show an increasing trend (even with a possible typo, the general pattern from 10g - 2cm³, 40g - 8cm³, 75g - 15cm³, 100g - 20cm³ suggests direct proportionality). So volume increases with mass.
From the data (volume: 2, 8, 15, 20, 4; mass: 10, 40, 75, 100, 80), when volume increases (e.g., 2→8→15→20), mass increases (10→40→75→100). The relationship is direct, so mass increases with volume.
Step1: Find the density
First, calculate density \(
ho=\frac{\text{mass}}{\text{volume}} \). Using data point (10g, 2cm³): \(
ho = \frac{10}{2}=5\ \text{g/cm}^3 \) (checking another point: \( \frac{40}{8} = 5\ \text{g/cm}^3 \), so density is \( 5\ \text{g/cm}^3 \)).
Step2: Calculate mass for 12 mL (12 cm³)
Use \( \text{mass}=
ho\times\text{volume} \). So \( \text{mass}=5\times12 = 60\ \text{g} \).

Snap & solve any problem in the app
Get step-by-step solutions on Sovi AI
Photo-based solutions with guided steps
Explore more problems and detailed explanations
As mass increases, the volume also increases (they are directly proportional, following \( \text{mass} \propto \text{volume} \) for a liquid, indicating a linear relationship typical of density - related data).