QUESTION IMAGE
Question
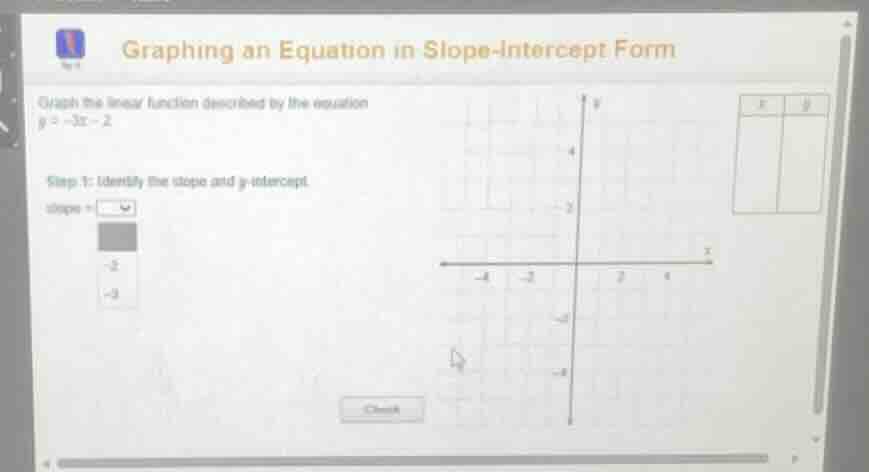
graphing an equation in slope-intercept form
graph the linear function described by the equation
( y = -3x - 2 )
step 1: identify the slope and y - intercept.
slope =
-2
-3
Step1: Recall slope-intercept form
The slope-intercept form of a linear equation is $y = mx + b$, where $m$ is the slope and $b$ is the y-intercept.
Step2: Match given equation to form
For the equation $y = -3x - 2$, compare to $y = mx + b$.
Slope $m = -3$, y-intercept $b = -2$.
Step3: Verify slope value
The dropdown options include -3, which matches our identified slope.

Snap & solve any problem in the app
Get step-by-step solutions on Sovi AI
Photo-based solutions with guided steps
Explore more problems and detailed explanations
Slope = $-3$, y-intercept = $-2$
To graph:
- Plot the y-intercept point $(0, -2)$ on the coordinate plane.
- Use the slope $\frac{-3}{1}$: from $(0, -2)$, move 3 units down and 1 unit right to plot a second point $(1, -5)$, or 3 units up and 1 unit left to plot $(-1, 1)$.
- Draw a straight line through the plotted points.