QUESTION IMAGE
Question
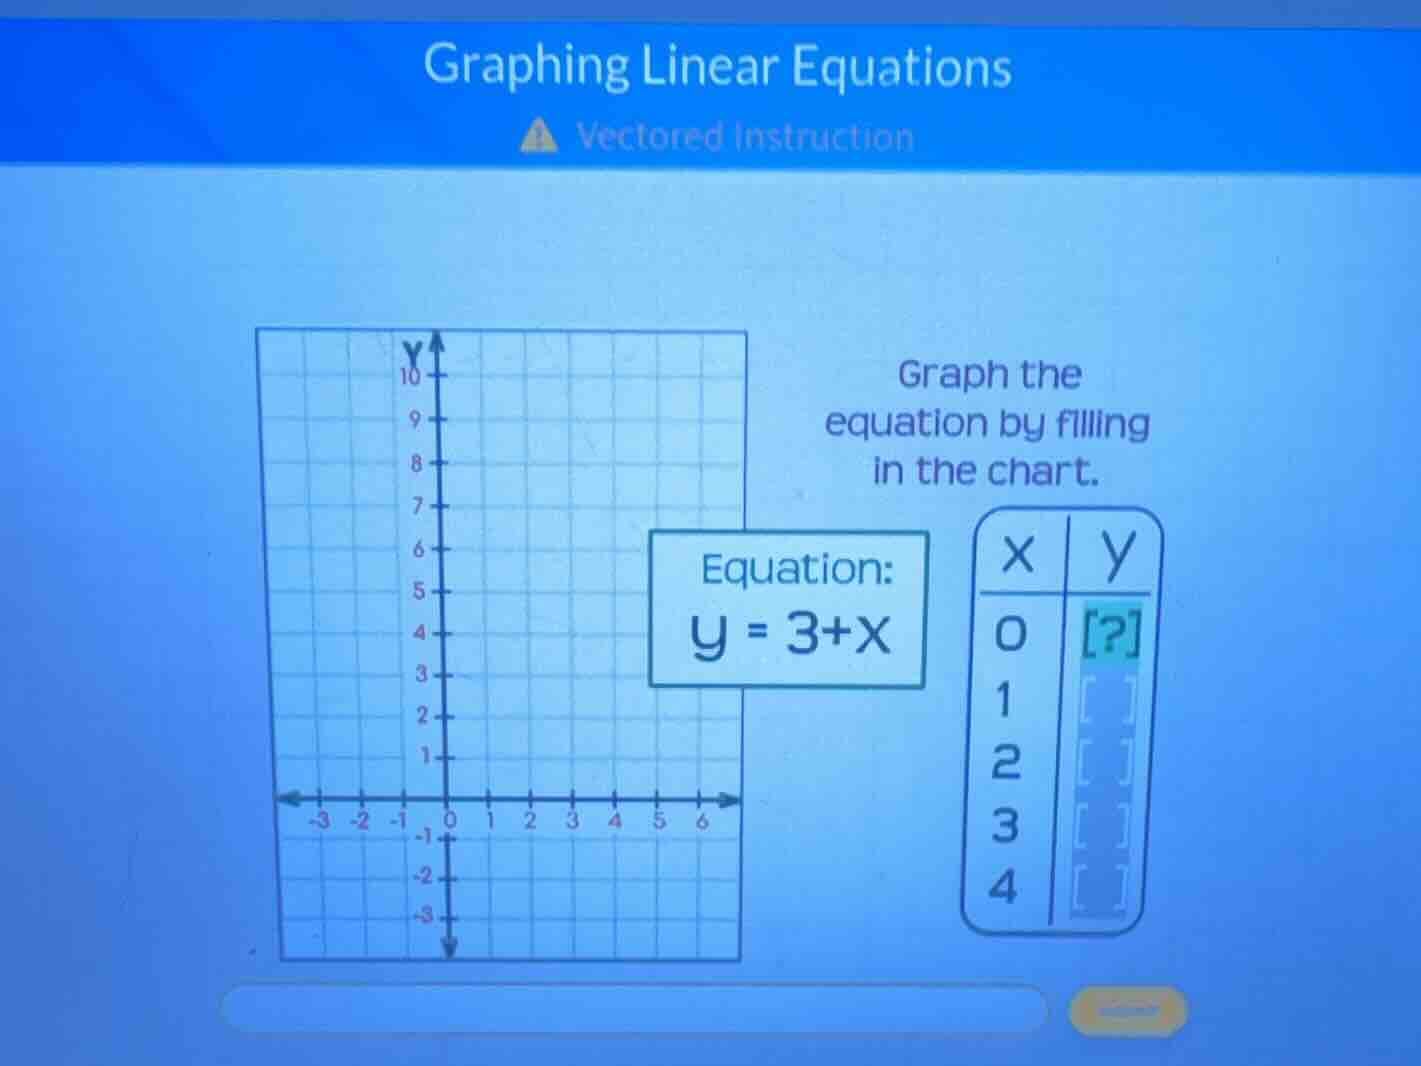
graphing linear equations
graph the equation by filling in the chart.
equation: y = 3 + x
x | y
0 | ?
1 |
2 |
3 |
4 |
Step1: Substitute x = 0 into the equation
We have the equation \( y = 3 + x \). When \( x = 0 \), we substitute \( x \) with 0 in the equation.
\( y = 3 + 0 \)
Step2: Calculate the value of y
Simplify the right - hand side of the equation. \( 3+0 = 3 \), so \( y = 3 \).

Snap & solve any problem in the app
Get step-by-step solutions on Sovi AI
Photo-based solutions with guided steps
Explore more problems and detailed explanations
When \( x = 0 \), \( y = 3 \). For the other values:
- When \( x = 1 \), \( y=3 + 1=4 \)
- When \( x = 2 \), \( y=3 + 2 = 5 \)
- When \( x = 3 \), \( y=3 + 3=6 \)
- When \( x = 4 \), \( y=3 + 4 = 7 \)
The completed table is:
| X | Y |
|---|---|
| 1 | 4 |
| 2 | 5 |
| 3 | 6 |
| 4 | 7 |