QUESTION IMAGE
Question
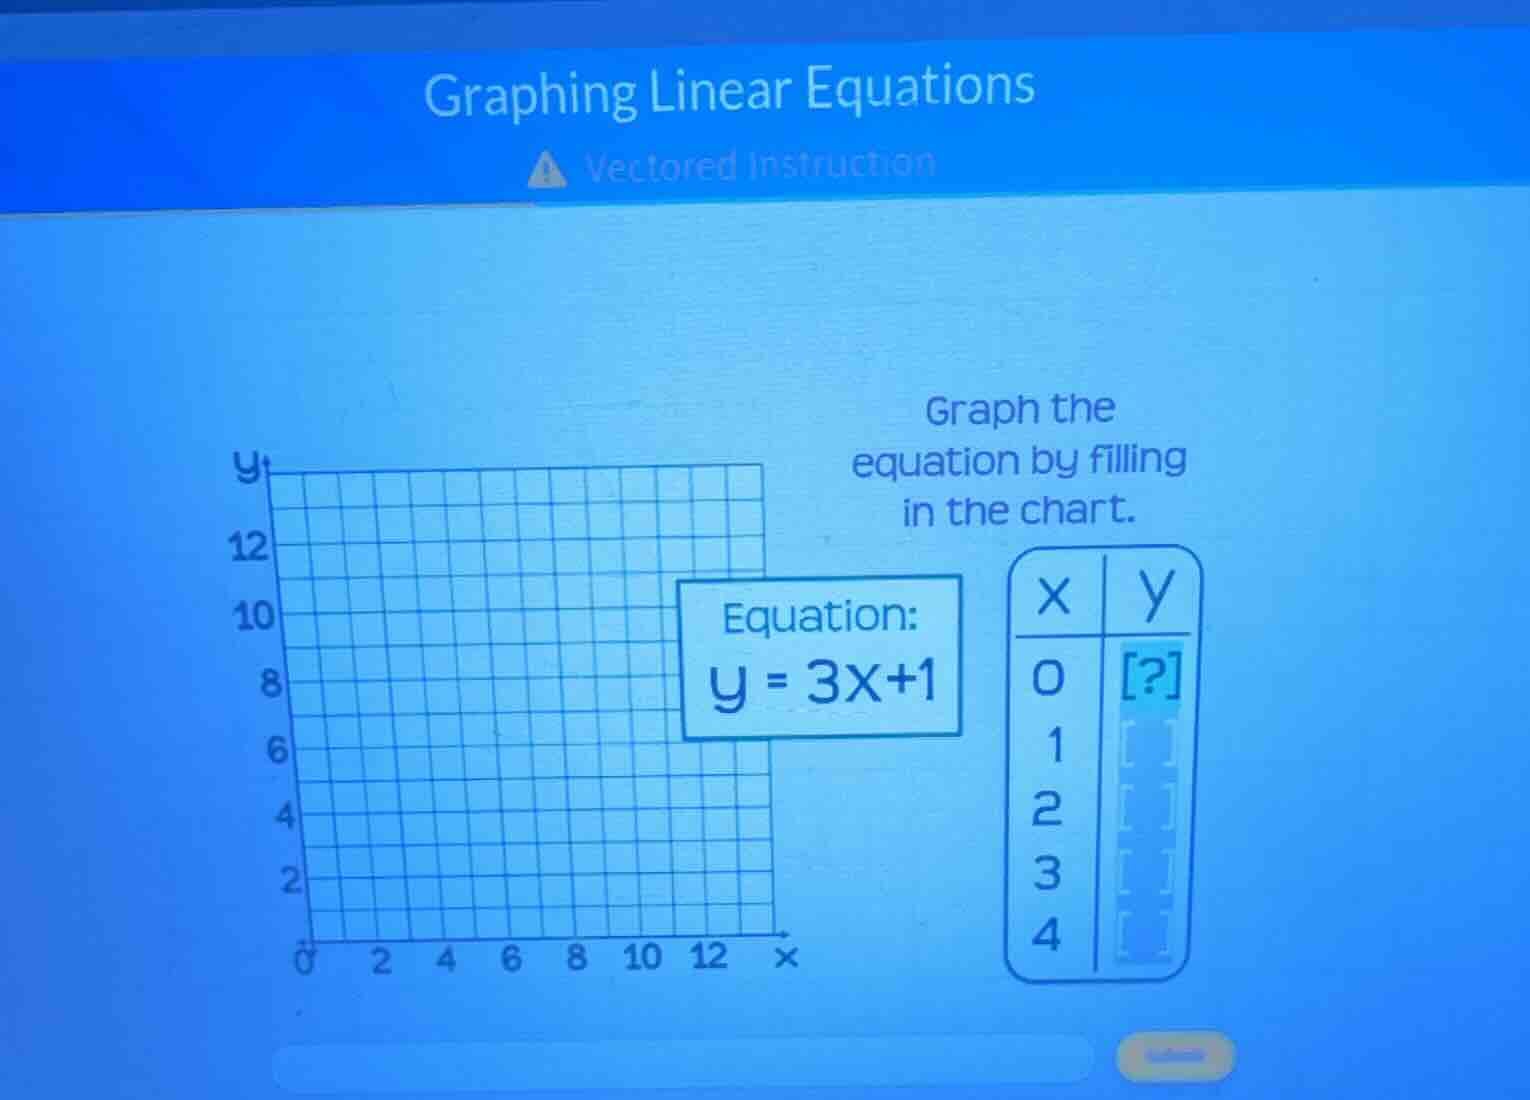
graphing linear equations
vectored instruction
graph the equation by filling in the chart.
equation: y = 3x + 1
(there is a coordinate grid with x - axis from 0 to 12 and y - axis from 0 to 12, and a table with x values 0, 1, 2, 3, 4 and y values to be filled, with the first y value boxed as ?)
Step1: Substitute x = 0 into the equation
We have the equation \( y = 3x + 1 \). When \( x = 0 \), we substitute this value into the equation.
\( y = 3(0) + 1 \)
Step2: Simplify the expression
First, calculate \( 3(0) \), which is 0. Then add 1 to it.
\( y = 0 + 1 = 1 \)

Snap & solve any problem in the app
Get step-by-step solutions on Sovi AI
Photo-based solutions with guided steps
Explore more problems and detailed explanations
1