QUESTION IMAGE
Question
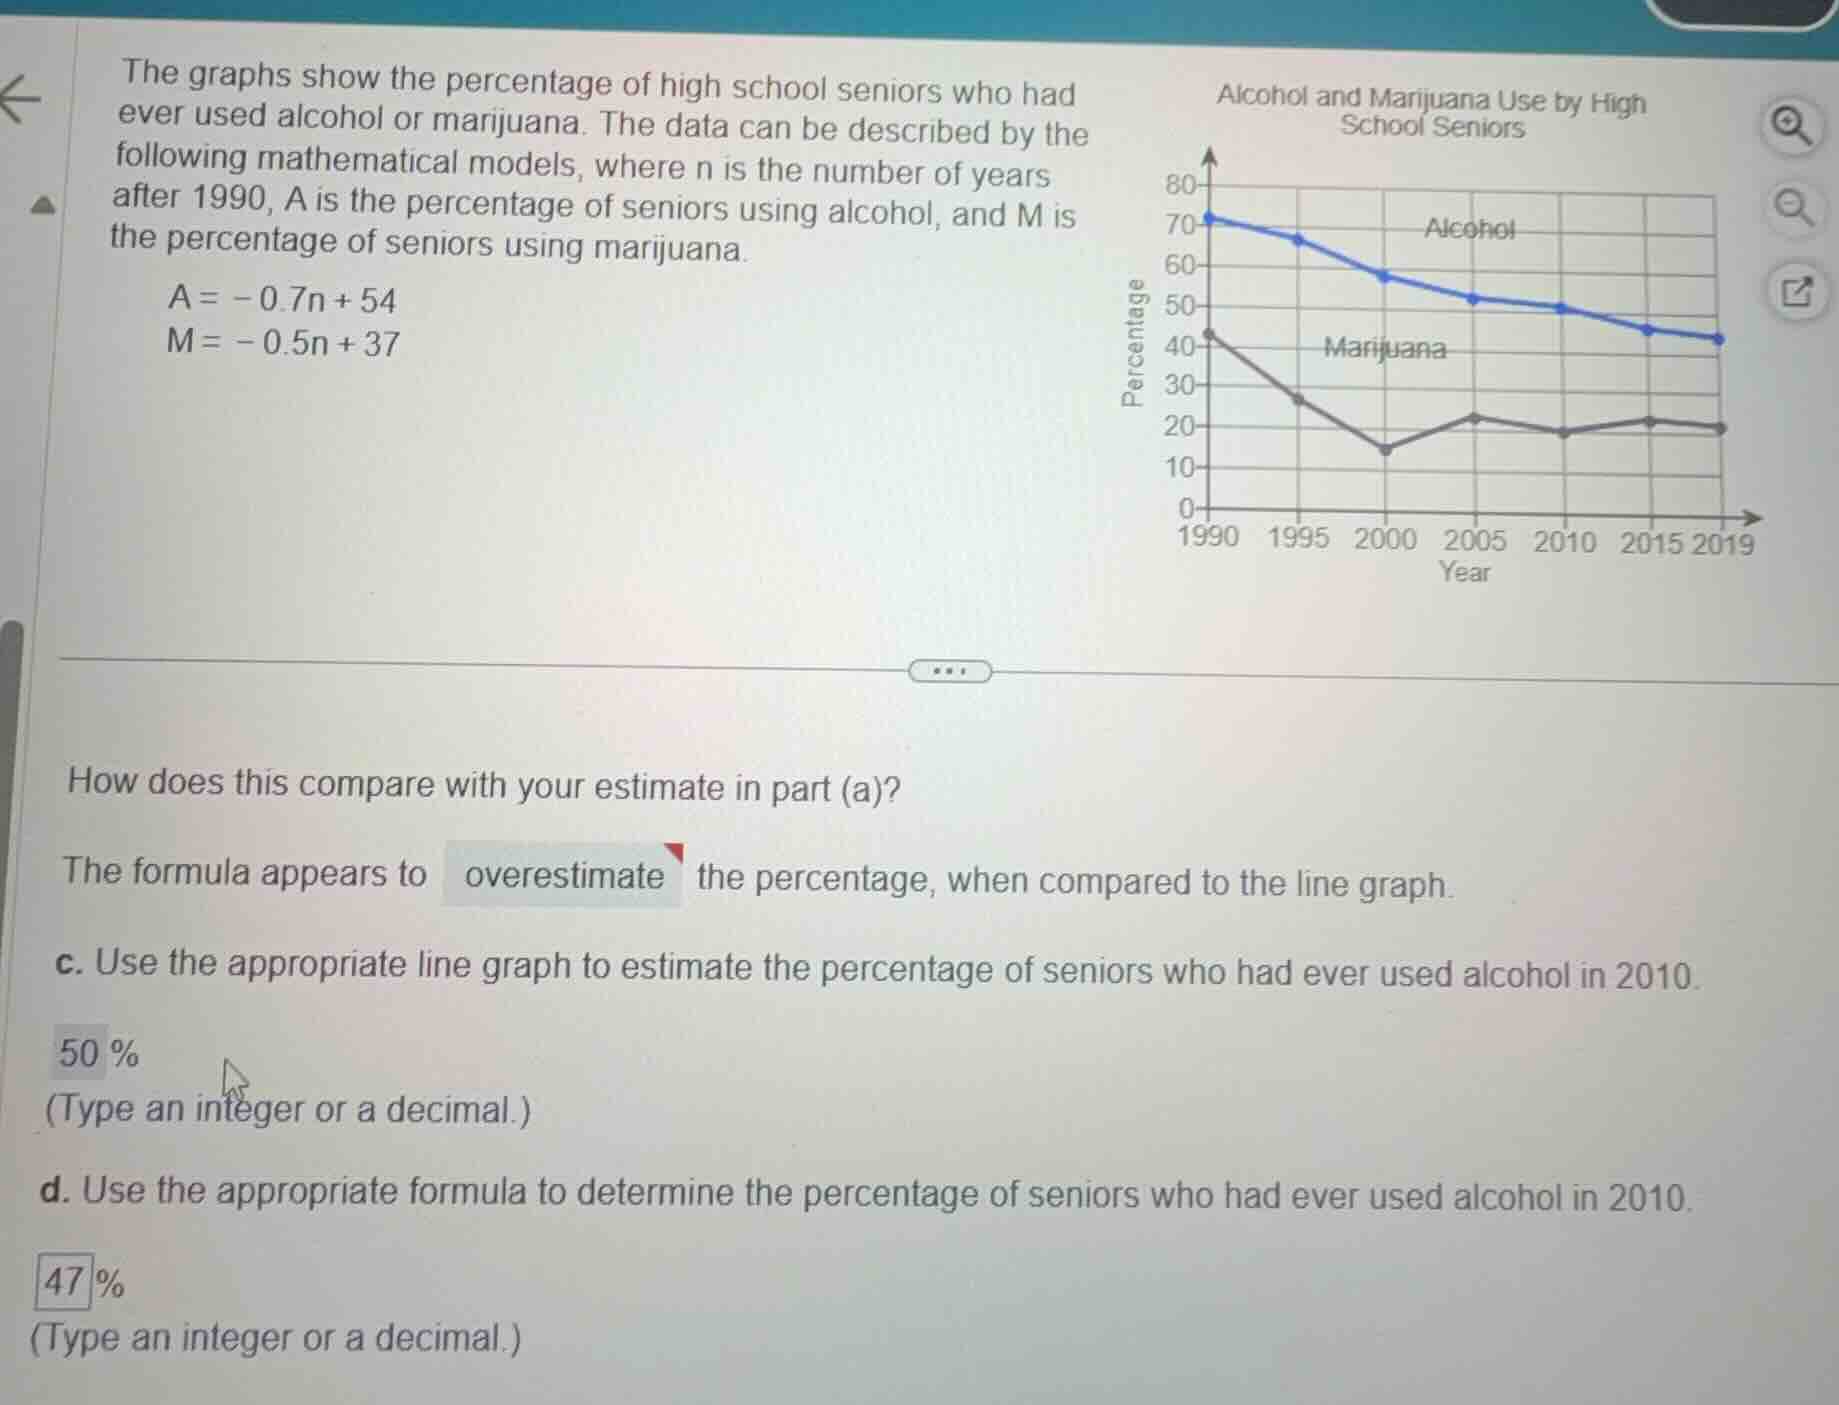
the graphs show the percentage of high school seniors who had ever used alcohol or marijuana. the data can be described by the following mathematical models, where n is the number of years after 1990, a is the percentage of seniors using alcohol, and m is the percentage of seniors using marijuana.
a = -0.7n + 54
m = -0.5n + 37
how does this compare with your estimate in part (a)?
the formula appears to overestimate the percentage, when compared to the line graph.
c. use the appropriate line graph to estimate the percentage of seniors who had ever used alcohol in 2010.
50 %
(type an integer or a decimal.)
d. use the appropriate formula to determine the percentage of seniors who had ever used alcohol in 2010.
47%
(type an integer or a decimal.)

Snap & solve any problem in the app
Get step-by-step solutions on Sovi AI
Photo-based solutions with guided steps
Explore more problems and detailed explanations
50 %
47 %
The formula appears to overestimate the percentage, when compared to the line graph.