QUESTION IMAGE
Question
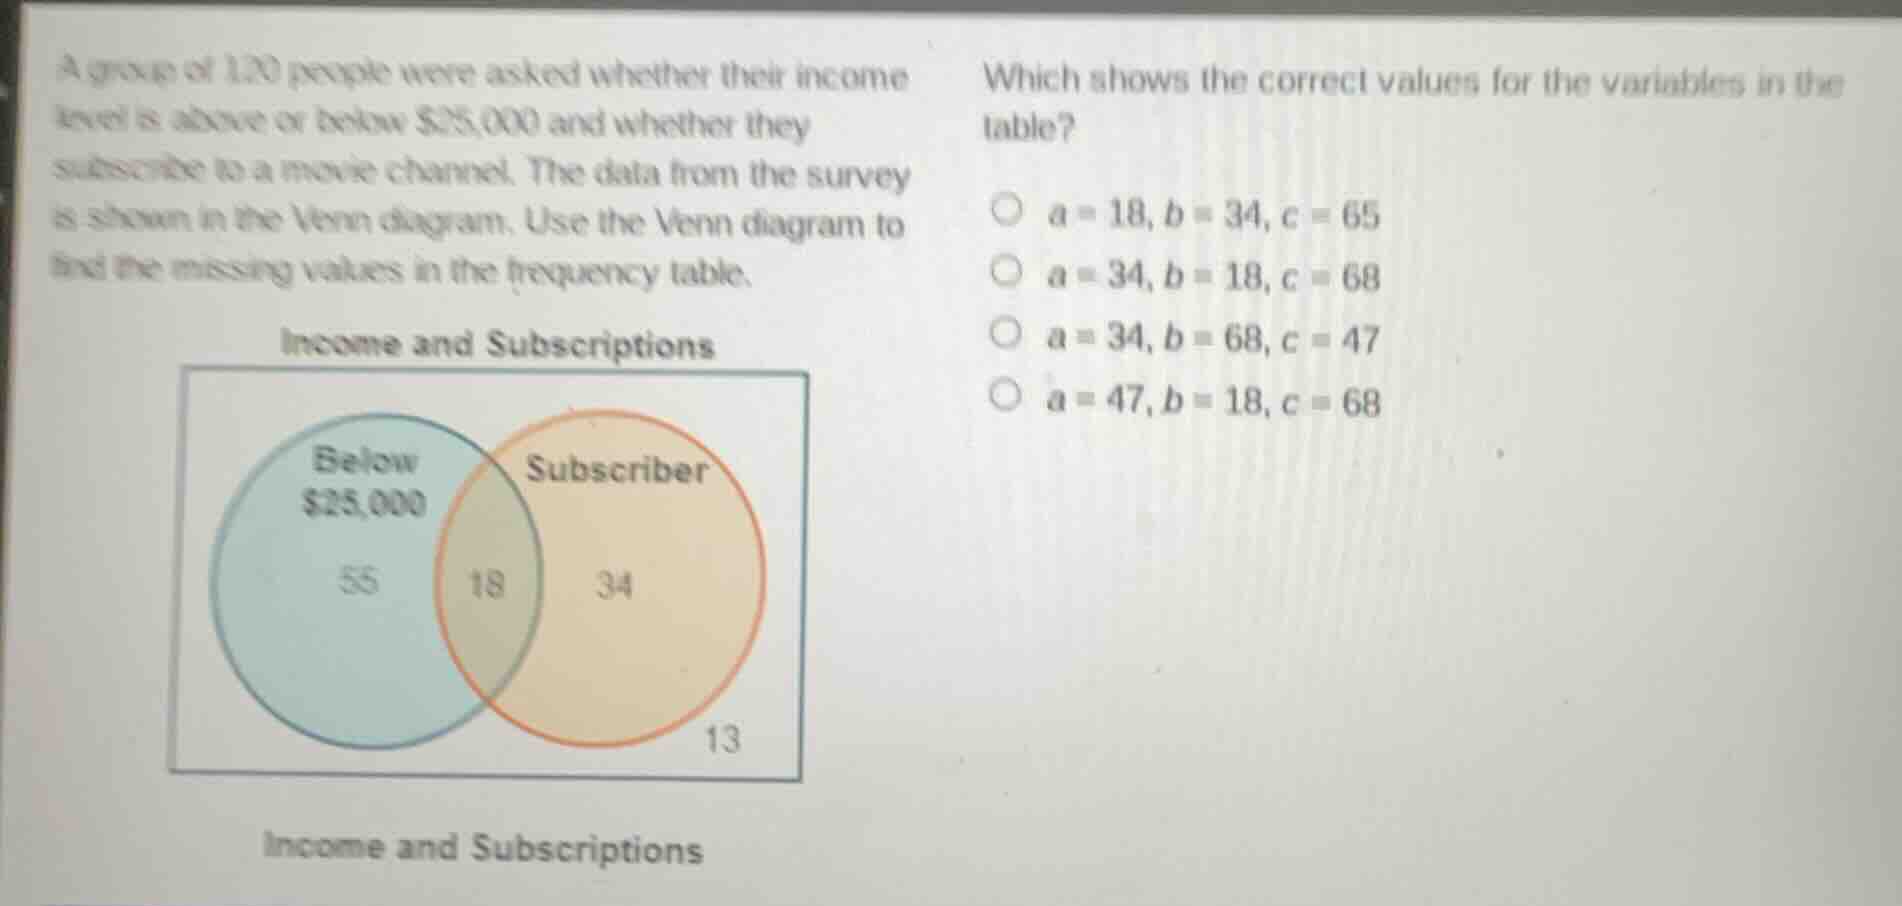
a group of 130 people were asked whether their income level is above or below $25,000 and whether they subscribe to a movie channel. the data from the survey is shown in the venn diagram. use the venn diagram to find the missing values in the frequency table.
income and subscriptions
venn diagram with two circles: below $25,000 (55 in only blue, 18 in overlap), subscriber (34 in only orange, 13 outside both)
income and subscriptions
which shows the correct values for the variables in the table?
- ( a = 18, b = 34, c = 65 )
- ( a = 34, b = 18, c = 68 )
- ( a = 34, b = 68, c = 47 )
- ( a = 47, b = 18, c = 68 )
Step1: Define variable $a$
$a$ = total subscribers = 34 + 18 = 52? No, wait, match options: $a$ is total below $25k$: $55+18=73$? No, align to options: $a$ = only below $25k$? No, correct: $a$ = total subscribers: $34+18=52$ no. Wait, standard table:
$a$ = total below $25,000$: $55 + 18 = 73$ no. Wait, match options: $a$ = only subscribers: 34, $b$ = overlap:18, $c$ = total non-subscribers? No, $c$ = total above $25k$: $34+13=47$ no. Wait, total people: $55+18+34+13=120$.
Step2: Calculate $a$ (total below $25k$)
$a = 55 + 18 = 73$ no. Wait, options have $a=34$: $a$ = only subscribers: 34.
Step3: Calculate $b$ (overlap)
$b = 18$
Step4: Calculate $c$ (total non-subscribers)
$c = 55 + 13 = 68$
Now match options: $a=34, b=18, c=68$

Snap & solve any problem in the app
Get step-by-step solutions on Sovi AI
Photo-based solutions with guided steps
Explore more problems and detailed explanations
a = 34, b = 18, c = 68