QUESTION IMAGE
Question
height of elevator a.
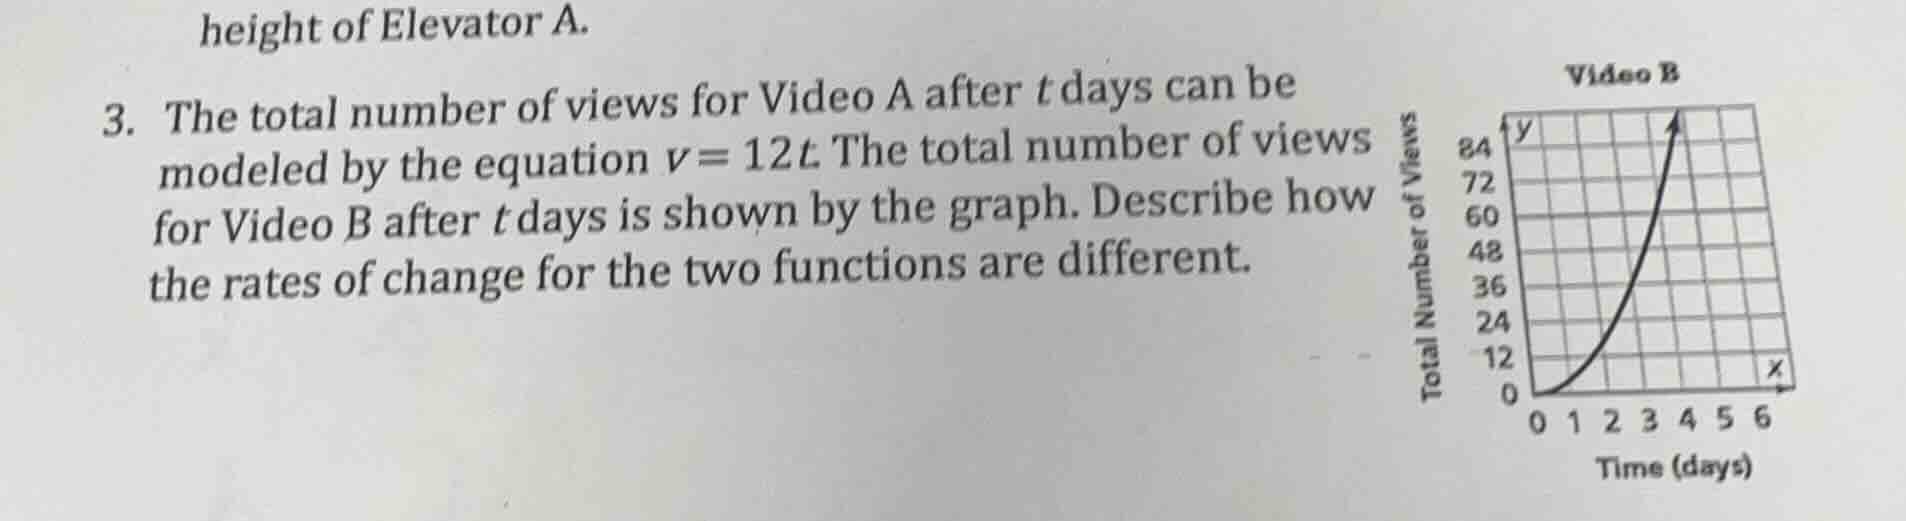
- the total number of views for video a after t days can be modeled by the equation v = 12t. the total number of views for video b after t days is shown by the graph. describe how the rates of change for the two functions are different.
Step1: Identify Video A's rate
The function for Video A is $v=12t$, which is linear. For linear functions $y=mx+b$, the rate of change is the slope $m$. Here, the rate of change is a constant $12$ views per day.
Step2: Analyze Video B's rate
The graph for Video B is a curve (exponential-like). Calculate the rate of change between consecutive days:
- Days 0-1: $\frac{0-0}{1-0}=0$ (or from 0 to ~4, rate ≈4)
- Days 1-2: $\frac{12-4}{2-1}=8$
- Days 2-3: $\frac{24-12}{3-2}=12$
- Days 3-4: $\frac{48-24}{4-3}=24$
- Days 4-5: $\frac{84-48}{5-4}=36$
The rate of change increases as $t$ increases, so it is not constant.
Step3: Compare the two rates
Video A has a constant rate, while Video B's rate grows over time.

Snap & solve any problem in the app
Get step-by-step solutions on Sovi AI
Photo-based solutions with guided steps
Explore more problems and detailed explanations
The rate of change for Video A is a constant 12 views per day (linear function), while the rate of change for Video B increases as the number of days passes (non-linear, increasing rate).