QUESTION IMAGE
Question
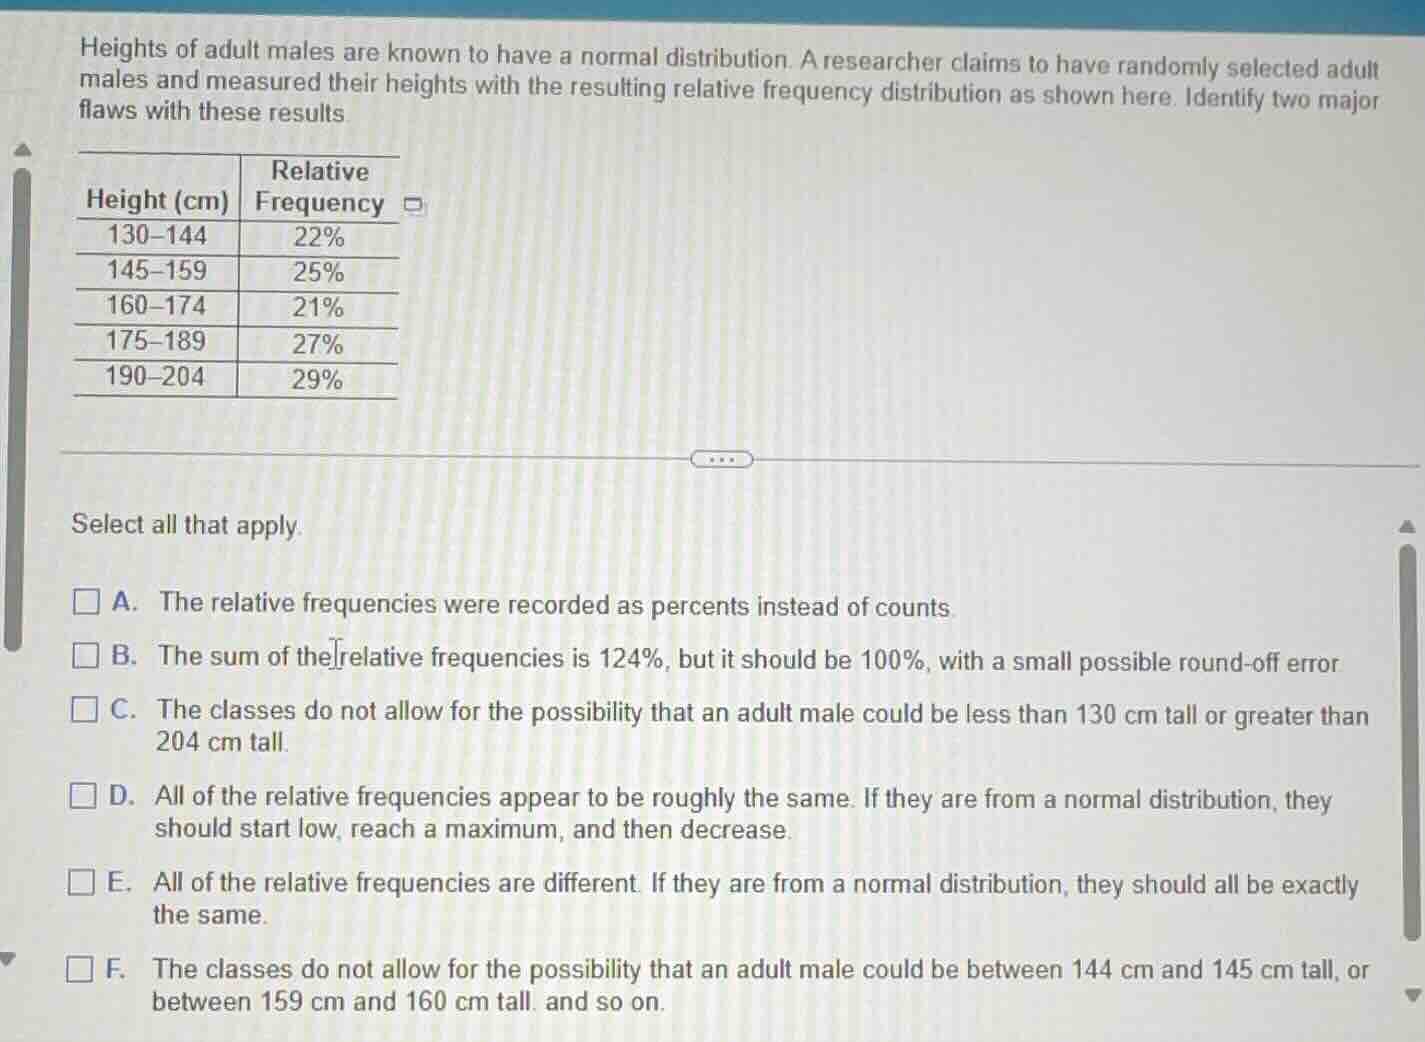
heights of adult males are known to have a normal distribution. a researcher claims to have randomly selected adult males and measured their heights with the resulting relative frequency distribution as shown here. identify two major flaws with these results
height (cm) | relative frequency
130–144 | 22%
145–159 | 25%
160–174 | 21%
175–189 | 27%
190–204 | 29%
select all that apply.
a. the relative frequencies were recorded as percents instead of counts.
b. the sum of the relative frequencies is 124%, but it should be 100%, with a small possible round - off error
c. the classes do not allow for the possibility that an adult male could be less than 130 cm tall or greater than 204 cm tall.
d. all of the relative frequencies appear to be roughly the same. if they are from a normal distribution, they should start low, reach a maximum, and then decrease.
e. all of the relative frequencies are different. if they are from a normal distribution, they should all be exactly the same.
f. the classes do not allow for the possibility that an adult male could be between 144 cm and 145 cm tall, or between 159 cm and 160 cm tall, and so on.
- For option B: Sum the relative frequencies: \(22\% + 25\% + 21\% + 27\% + 29\% = 124\%\), but relative frequencies in a distribution should sum to \(100\%\) (allowing for small round - off errors), so this is a flaw.
- For option D: A normal distribution of heights should have a bell - shaped curve. The relative frequencies should start low, increase to a peak (maximum frequency), and then decrease. Here, the frequencies are roughly similar in magnitude, which is not consistent with a normal distribution.
- For option F: The class intervals are \(130 - 144\), \(145 - 159\), etc. There is a gap between \(144\) and \(145\), \(159\) and \(160\), etc. So, a height value between these gaps (e.g., \(144.5\) cm or \(159.5\) cm) has no class to belong to, which is a flaw in the frequency distribution.
Option A is incorrect because relative frequencies can be expressed as percents. Option C is incorrect because the height range of adult males is not restricted to just the given classes in a way that is a major flaw (the main issue with classes here is the gaps between them, not the overall range's endpoints). Option E is incorrect because in a normal distribution, relative frequencies are not expected to be exactly the same.

Snap & solve any problem in the app
Get step-by-step solutions on Sovi AI
Photo-based solutions with guided steps
Explore more problems and detailed explanations
B. The sum of the relative frequencies is 124%, but it should be 100%, with a small possible round - off error
D. All of the relative frequencies appear to be roughly the same. If they are from a normal distribution, they should start low, reach a maximum, and then decrease.
F. The classes do not allow for the possibility that an adult male could be between 144 cm and 145 cm tall, or between 159 cm and 160 cm tall, and so on.