QUESTION IMAGE
Question
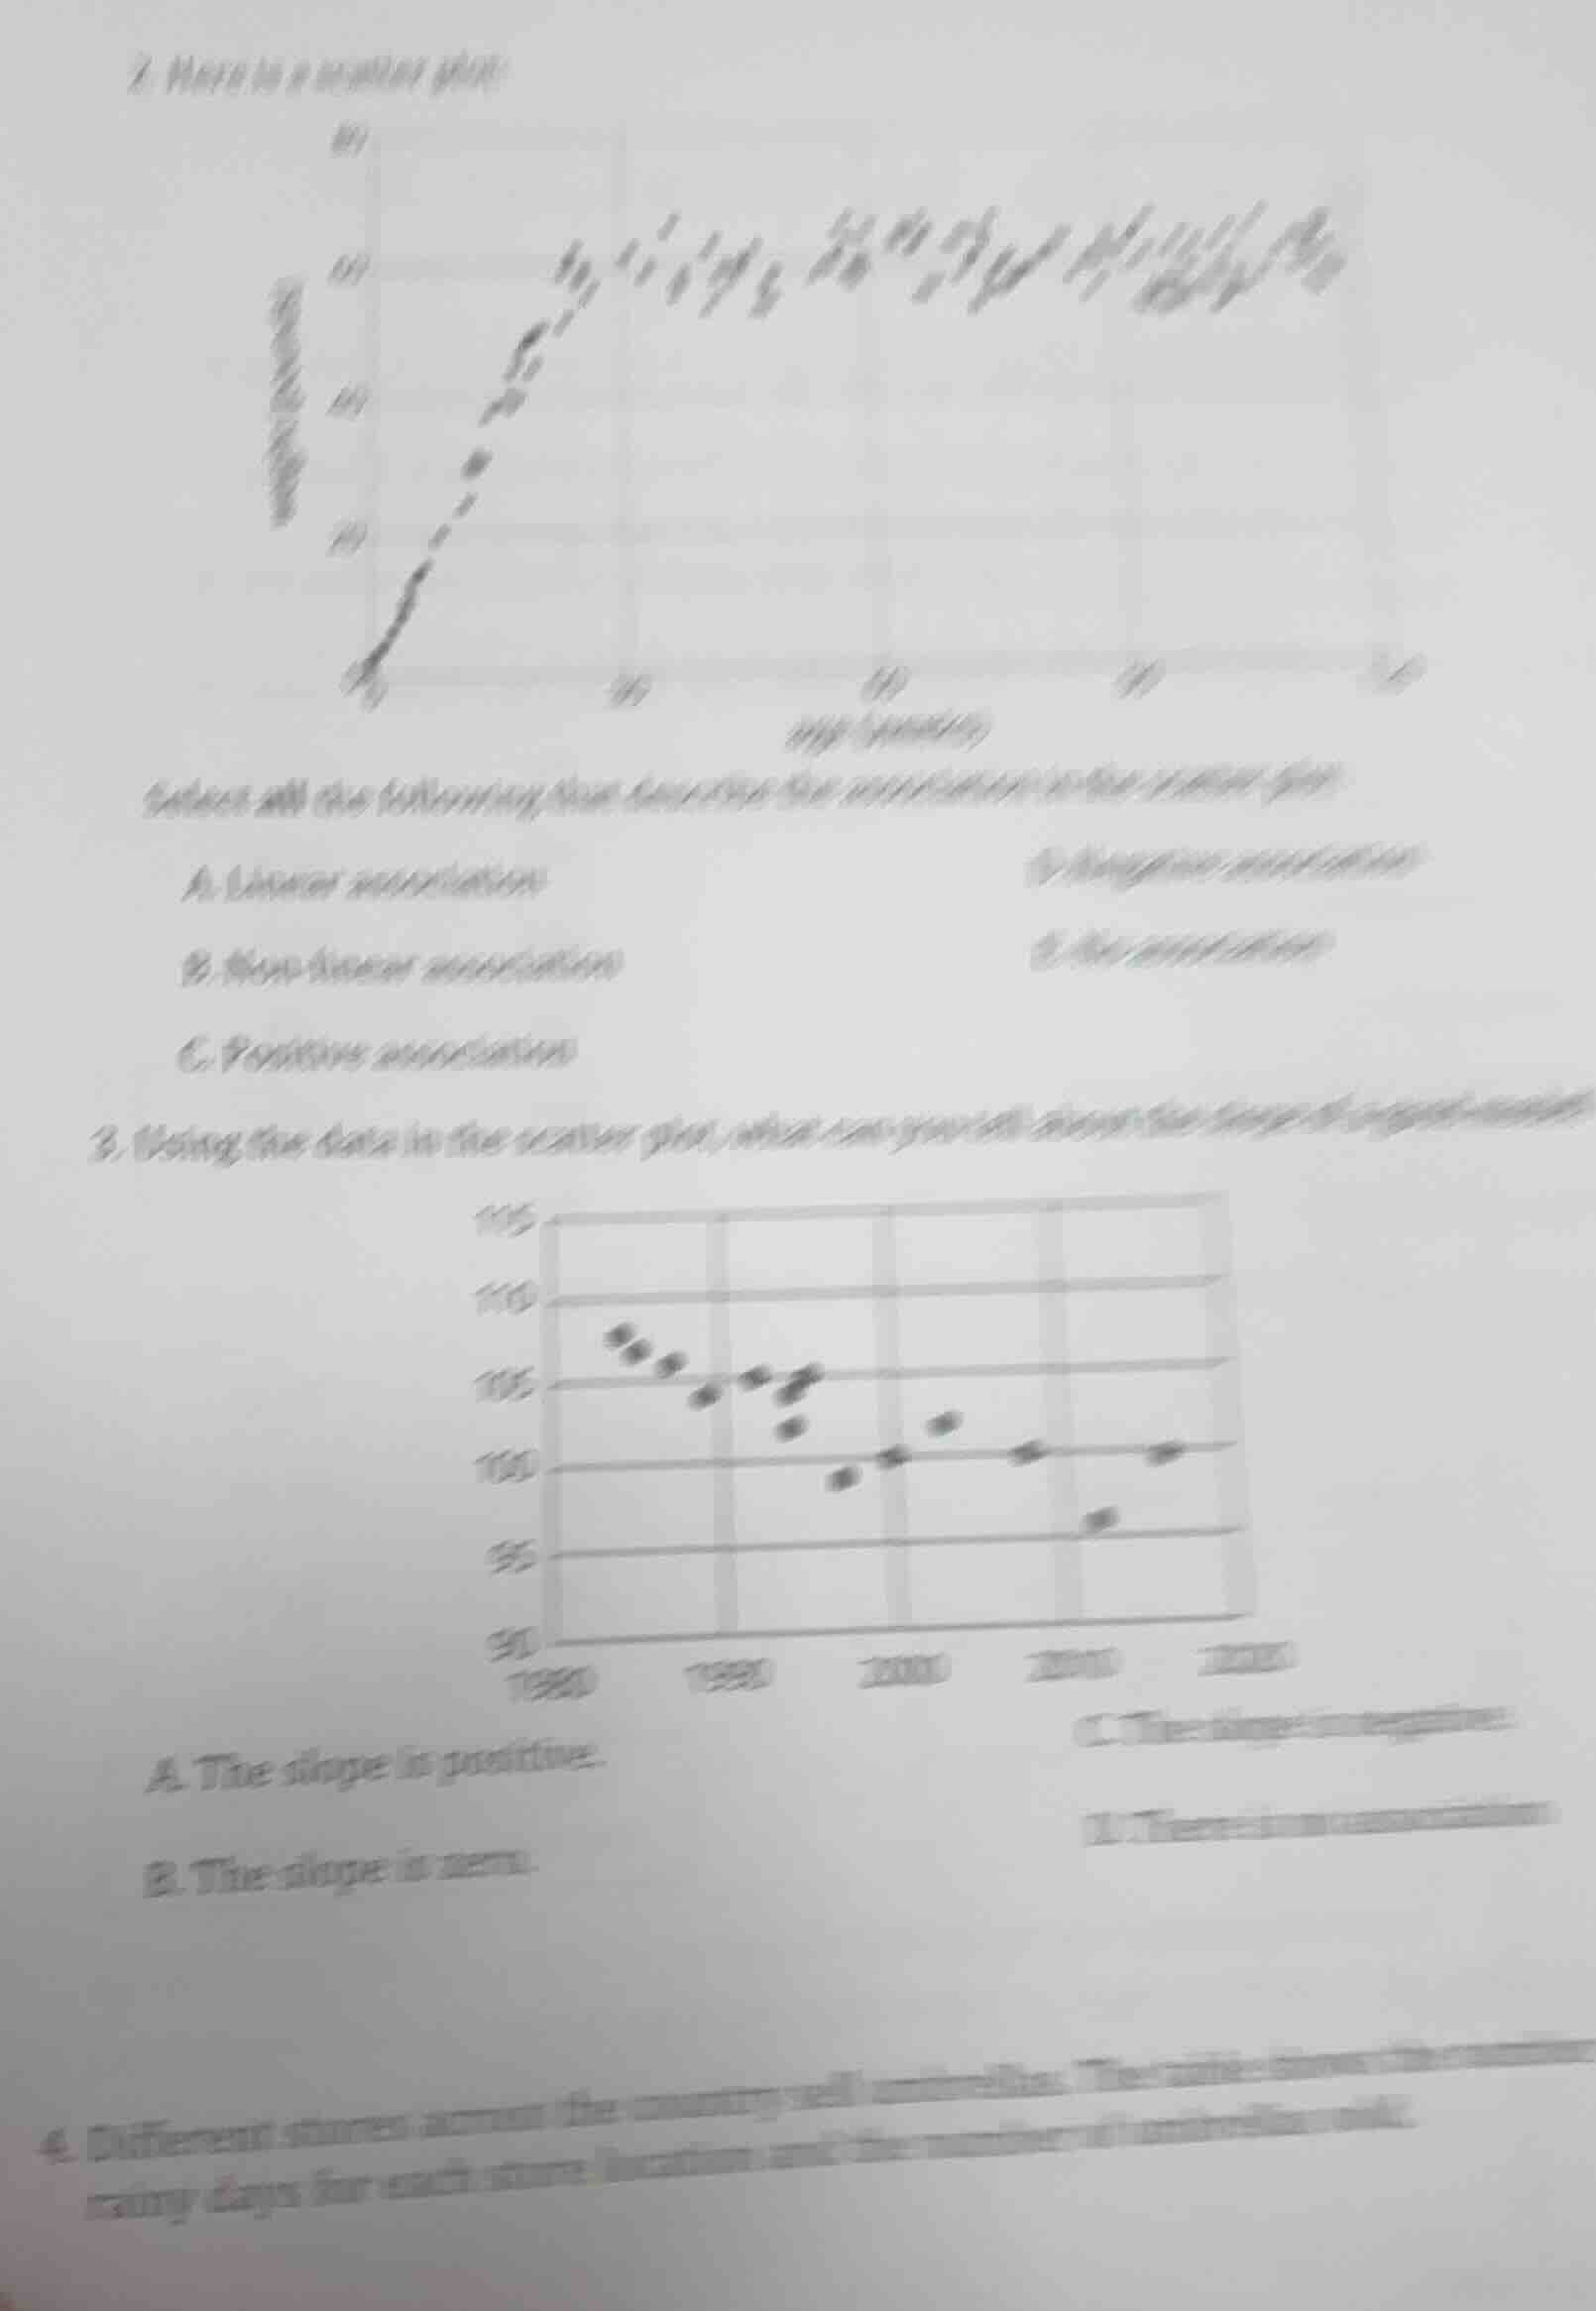
- here is a scatter plot:select all the following that describe the association in the scatter plota. linear associationb. non-linear associationc. positive associationd. negative associatione. no association3. using the data in the scatter plot, what can you tell about the slope of a trend line?a. the slope is positive.b. the slope is zero.c. the slope is negative.d. there is no association4. different stores across the country sell umbrellas. the table shows the number of rainy days for each store location and the number of umbrellas sold.
Brief Explanations
For question 2: The scatter plot shows points that first follow a straight upward trend, then flatten, so it has a non-linear pattern. As the x-value increases, the y-value generally increases first, so there is a positive association overall.
For question 3: The scatter plot shows y-values decreasing as x-values increase, so the slope of a trend line would be negative.

Snap & solve any problem in the app
Get step-by-step solutions on Sovi AI
Photo-based solutions with guided steps
Explore more problems and detailed explanations
- B. Non-linear association, C. Positive association
- C. The slope is negative