QUESTION IMAGE
Question
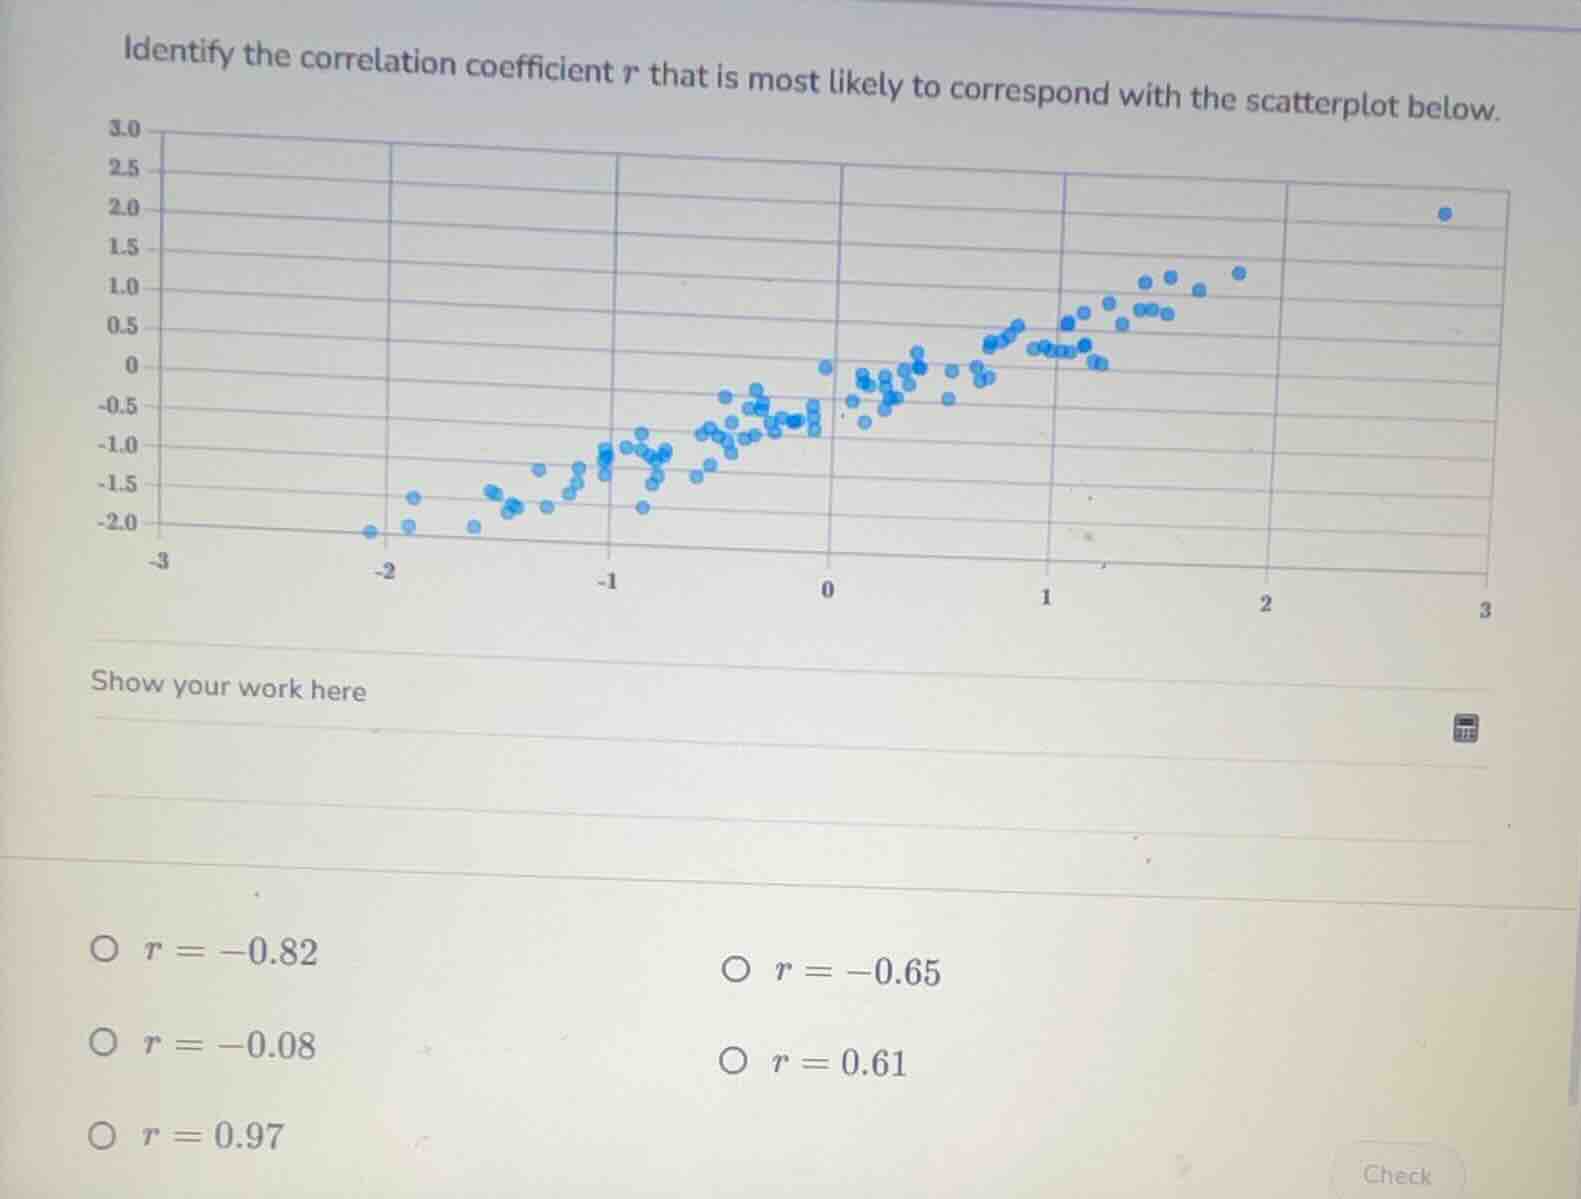
identify the correlation coefficient ( r ) that is most likely to correspond with the scatterplot below.
show your work here
( \bigcirc r = -0.82 ) ( \bigcirc r = -0.65 )
( \bigcirc r = -0.08 ) ( \bigcirc r = 0.61 )
( \bigcirc r = 0.97 )
Step1: Analyze the scatterplot trend
The scatterplot shows a positive trend (as x increases, y generally increases), so the correlation coefficient \( r \) should be positive (eliminating negative options: \( r = -0.82 \), \( r = -0.65 \), \( r = -0.08 \)).
Step2: Analyze the strength of the correlation
The points do not form a very tight cluster around a straight line, so the correlation is moderate, not extremely strong (eliminating \( r = 0.97 \), which is very strong). Among the remaining positive option (\( r = 0.61 \)), it represents a moderate positive correlation, which matches the scatterplot's pattern.

Snap & solve any problem in the app
Get step-by-step solutions on Sovi AI
Photo-based solutions with guided steps
Explore more problems and detailed explanations
\( r = 0.61 \)