QUESTION IMAGE
Question
identifying the graph of an inequality
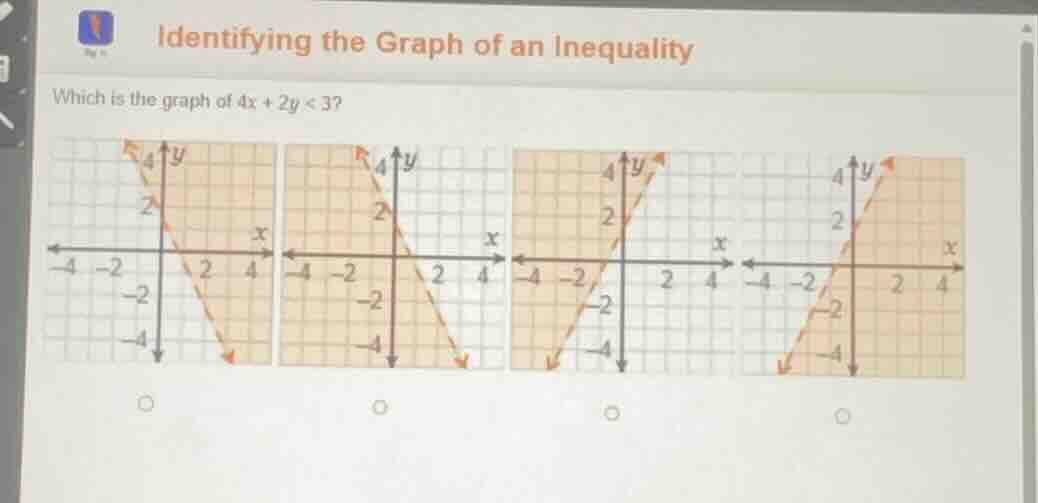
which is the graph of $4x + 2y < 3$?
Step1: Rewrite inequality to slope-intercept form
Start with the given inequality and solve for $y$:
$$4x + 2y < 3$$
Subtract $4x$ from both sides:
$$2y < -4x + 3$$
Divide all terms by 2:
$$y < -2x + \frac{3}{2}$$
Step2: Identify line properties
The boundary line is $y = -2x + \frac{3}{2}$, which has a slope of $-2$ and a y-intercept of $\frac{3}{2}$ (or 1.5). Since the inequality uses $<$ (not $\leq$), the boundary line is dashed.
Step3: Determine shaded region
For $y < \text{(linear expression)}$, we shade the region below the boundary line.
Step4: Match to the graph
A line with slope $-2$ decreases from left to right, has a dashed line, and shading below it. This matches the second graph from the left.

Snap & solve any problem in the app
Get step-by-step solutions on Sovi AI
Photo-based solutions with guided steps
Explore more problems and detailed explanations
The correct graph is the second one (left to right: dashed decreasing line with shading below the line).