QUESTION IMAGE
Question
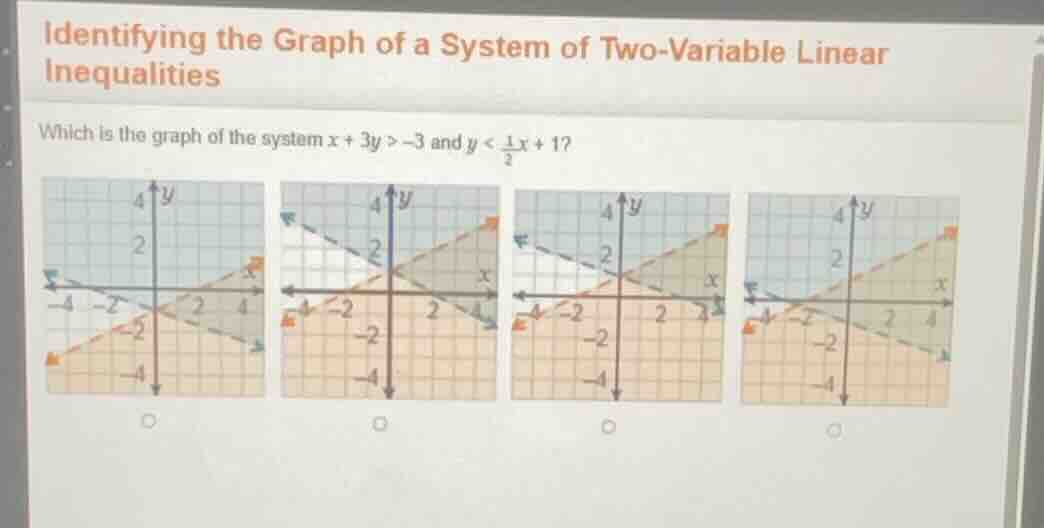
identifying the graph of a system of two - variable linear inequalities
which is the graph of the system ( x + 3y > - 3 ) and ( y < \frac{1}{2}x + 1 )?
Step1: Rewrite first inequality to slope-intercept
Rearrange $x + 3y > -3$ to solve for $y$:
$3y > -x - 3$
$y > -\frac{1}{3}x - 1$
This is a dashed line (since $>$) with slope $-\frac{1}{3}$, y-intercept $-1$, shaded above the line.
Step2: Analyze second inequality
The inequality $y < \frac{1}{2}x + 1$ is already in slope-intercept form:
It is a dashed line (since $<$) with slope $\frac{1}{2}$, y-intercept $1$, shaded below the line.
Step3: Find overlapping shaded region
The correct graph has:
- Dashed line $y = -\frac{1}{3}x - 1$, shaded above it
- Dashed line $y = \frac{1}{2}x + 1$, shaded below it
- The overlap is the region that satisfies both inequalities.

Snap & solve any problem in the app
Get step-by-step solutions on Sovi AI
Photo-based solutions with guided steps
Explore more problems and detailed explanations
The third graph (left to right, the one with the overlapping shaded region between the two dashed lines, bounded above by $y=\frac{1}{2}x+1$ and below by $y=-\frac{1}{3}x-1$)