QUESTION IMAGE
Question
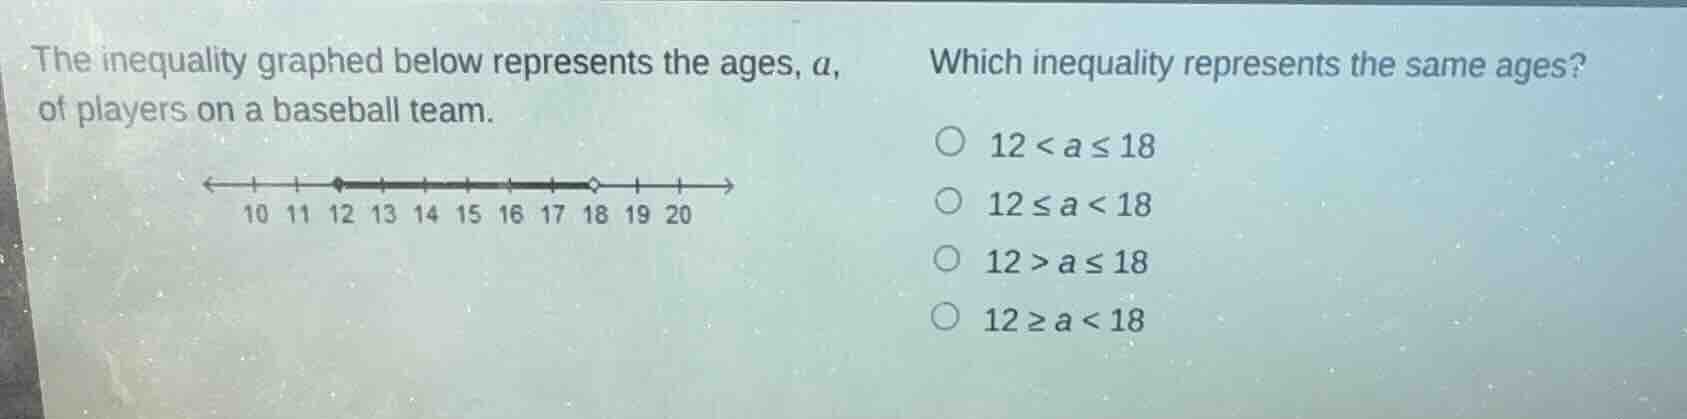
the inequality graphed below represents the ages, a, of players on a baseball team.
number line from 10 to 20, with a closed dot at 12 and an open dot at 18, and the line shaded between them
which inequality represents the same ages?
- $12 < a \leq 18$
- $12 \leq a < 18$
- $12 > a \leq 18$
- $12 \geq a < 18$
Step1: Analyze the number line
The closed circle at 12 means \( a \) can be equal to 12 (since a closed circle includes the point), and the open circle at 18 means \( a \) cannot be equal to 18 (an open circle excludes the point). The line is between 12 and 18, so the inequality should include 12 ( \( \geq \)) and exclude 18 ( \( < \)).
Step2: Match with options
Looking at the options, the inequality \( 12 \leq a < 18 \) matches the analysis: \( a \) is greater than or equal to 12 and less than 18.

Snap & solve any problem in the app
Get step-by-step solutions on Sovi AI
Photo-based solutions with guided steps
Explore more problems and detailed explanations
B. \( 12 \leq a < 18 \)