QUESTION IMAGE
Question
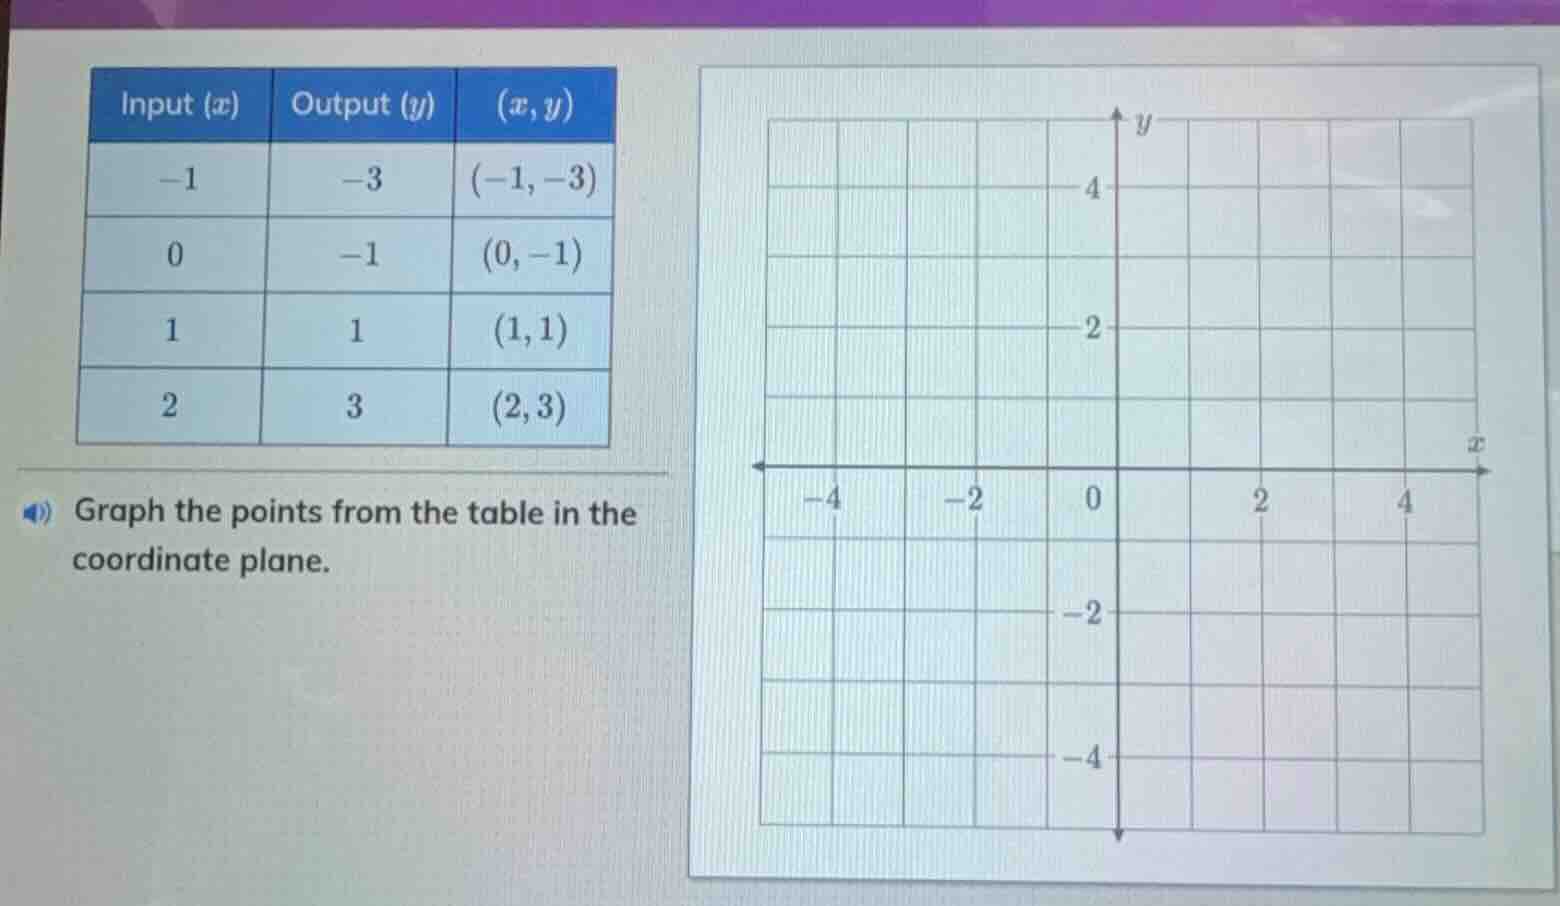
input (x) output (y) (x,y) -1 -3 (-1,-3) 0 -1 (0,-1) 1 1 (1,1) 2 3 (2,3) graph the points from the table in the coordinate plane.
Step1: Plot (-1, -3)
Find x = -1 on the x - axis and y = -3 on the y - axis. Mark the point at their intersection.
Step2: Plot (0, -1)
Find x = 0 (the y - axis) and y = -1 on the y - axis. Mark the point at their intersection.
Step3: Plot (1, 1)
Find x = 1 on the x - axis and y = 1 on the y - axis. Mark the point at their intersection.
Step4: Plot (2, 3)
Find x = 2 on the x - axis and y = 3 on the y - axis. Mark the point at their intersection.

Snap & solve any problem in the app
Get step-by-step solutions on Sovi AI
Photo-based solutions with guided steps
Explore more problems and detailed explanations
The points \((-1, -3)\), \((0, -1)\), \((1, 1)\), and \((2, 3)\) are plotted on the coordinate plane as described in the steps. (Note: Since this is a graphing task, the final answer is the visual representation of these points on the given coordinate grid.)