QUESTION IMAGE
Question
interpreting slope
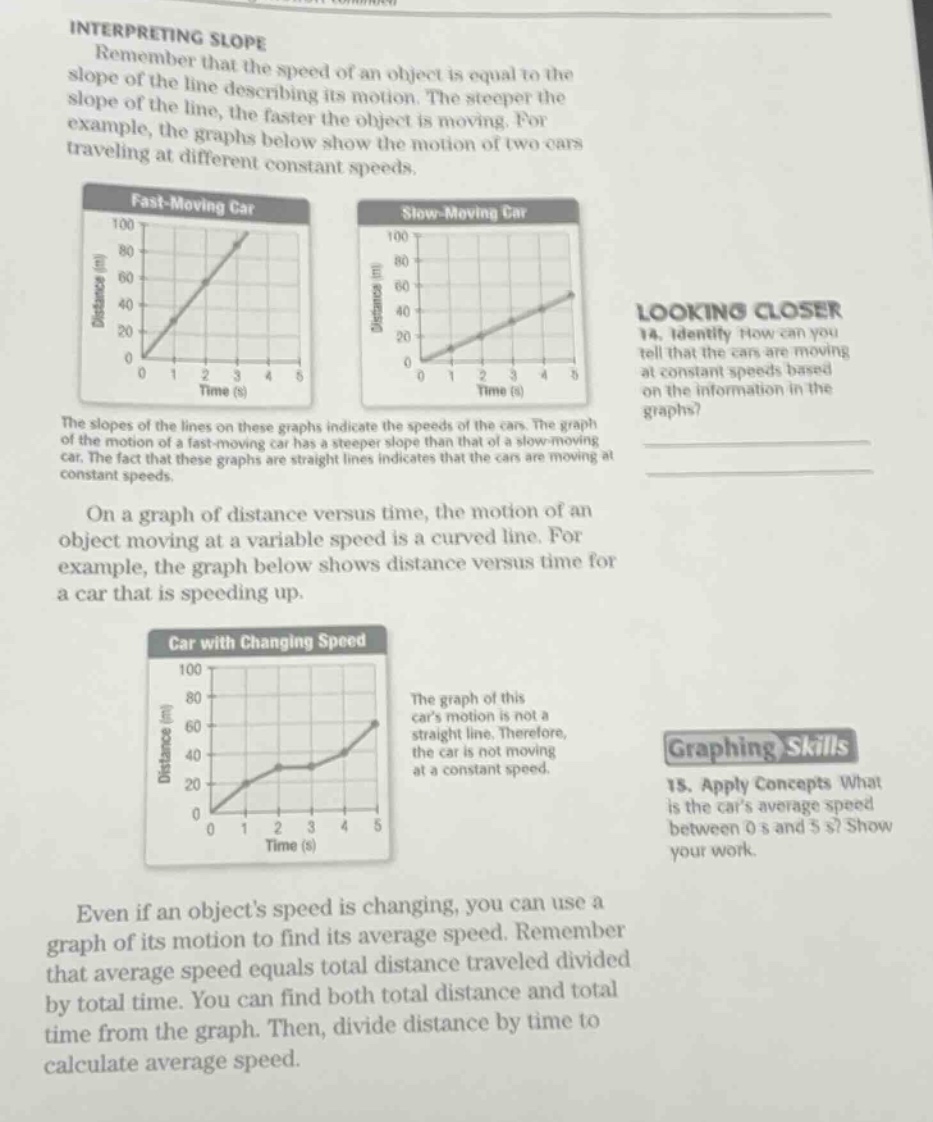
remember that the speed of an object is equal to the slope of the line describing its motion. the steeper the slope of the line, the faster the object is moving. for example, the graphs below show the motion of two cars traveling at different constant speeds.
the slopes of the lines on these graphs indicate the speeds of the cars. the graph of the motion of a fast - moving car has a steeper slope than that of a slow - moving car. the fact that these graphs are straight lines indicates that the cars are moving at constant speeds.
on a graph of distance versus time, the motion of an object moving at a variable speed is a curved line. for example, the graph below shows distance versus time for a car that is speeding up.
the graph of this car’s motion is not a straight line. therefore, the car is not moving at a constant speed.
even if an object’s speed is changing, you can use a graph of its motion to find its average speed. remember that average speed equals total distance traveled divided by total time. you can find both total distance and total time from the graph. then, divide distance by time to calculate average speed.
looking closer
- identify how can you tell that the cars are moving at constant speeds based on the information in the graphs?
graphing skills
- apply concepts what is the car’s average speed between 0 s and 5 s? show your work.
Question 14
To determine if cars move at constant speeds from distance - time graphs, we use the property of the graph's line. A straight - line graph in a distance - time plot implies a constant rate of change of distance with respect to time. Since speed is defined as the rate of change of distance with time ($v=\frac{\Delta d}{\Delta t}$), a constant rate of change of distance with time means a constant speed. So, if the distance - time graph is a straight line, the car is moving at a constant speed.
Step1: Recall the formula for average speed
The formula for average speed ($v_{avg}$) is given by the total distance traveled ($d_{total}$) divided by the total time taken ($t_{total}$), i.e., $v_{avg}=\frac{d_{total}}{t_{total}}$.
Step2: Determine the total distance and total time from the graph
From the graph of the car with changing speed, at $t = 0$ s, the distance $d = 0$ m, and at $t=5$ s, the distance $d = 60$ m (by looking at the "Car with Changing Speed" graph, the final distance at $t = 5$ s is 60 m). So, the total distance traveled $d_{total}=60 - 0=60$ m and the total time taken $t_{total}=5 - 0 = 5$ s.
Step3: Calculate the average speed
Substitute the values of $d_{total}$ and $t_{total}$ into the formula for average speed: $v_{avg}=\frac{60\space m}{5\space s}=12\space m/s$.

Snap & solve any problem in the app
Get step-by-step solutions on Sovi AI
Photo-based solutions with guided steps
Explore more problems and detailed explanations
We can tell the cars are moving at constant speeds because their distance - time graphs are straight lines. A straight line on a distance - time graph indicates that the rate of change of distance with respect to time (which is speed) is constant.