QUESTION IMAGE
Question
investigation 1: serengeti animal eating patterns
analyze the resource your group is assigned and create a poster illustrating what you learned that relates to our unit and lesson driving questions.
making sense of investigation 1
during the gallery walk, answer the following questions. i recommend reviewing several posters of the same resource to ensure the information you obtain is accurate.
- what do buffalo eat during the dry season?
- what do buffalo eat during the wet season?
8a. do buffalo compete for food with other herbivores? if so, for what food and when?
__ buffalo do not compete for food with other herbivores.
__ buffalo do compete for food with other herbivores.
8b. if buffalo do compete for food, what food do they compete for and during which season(s)?
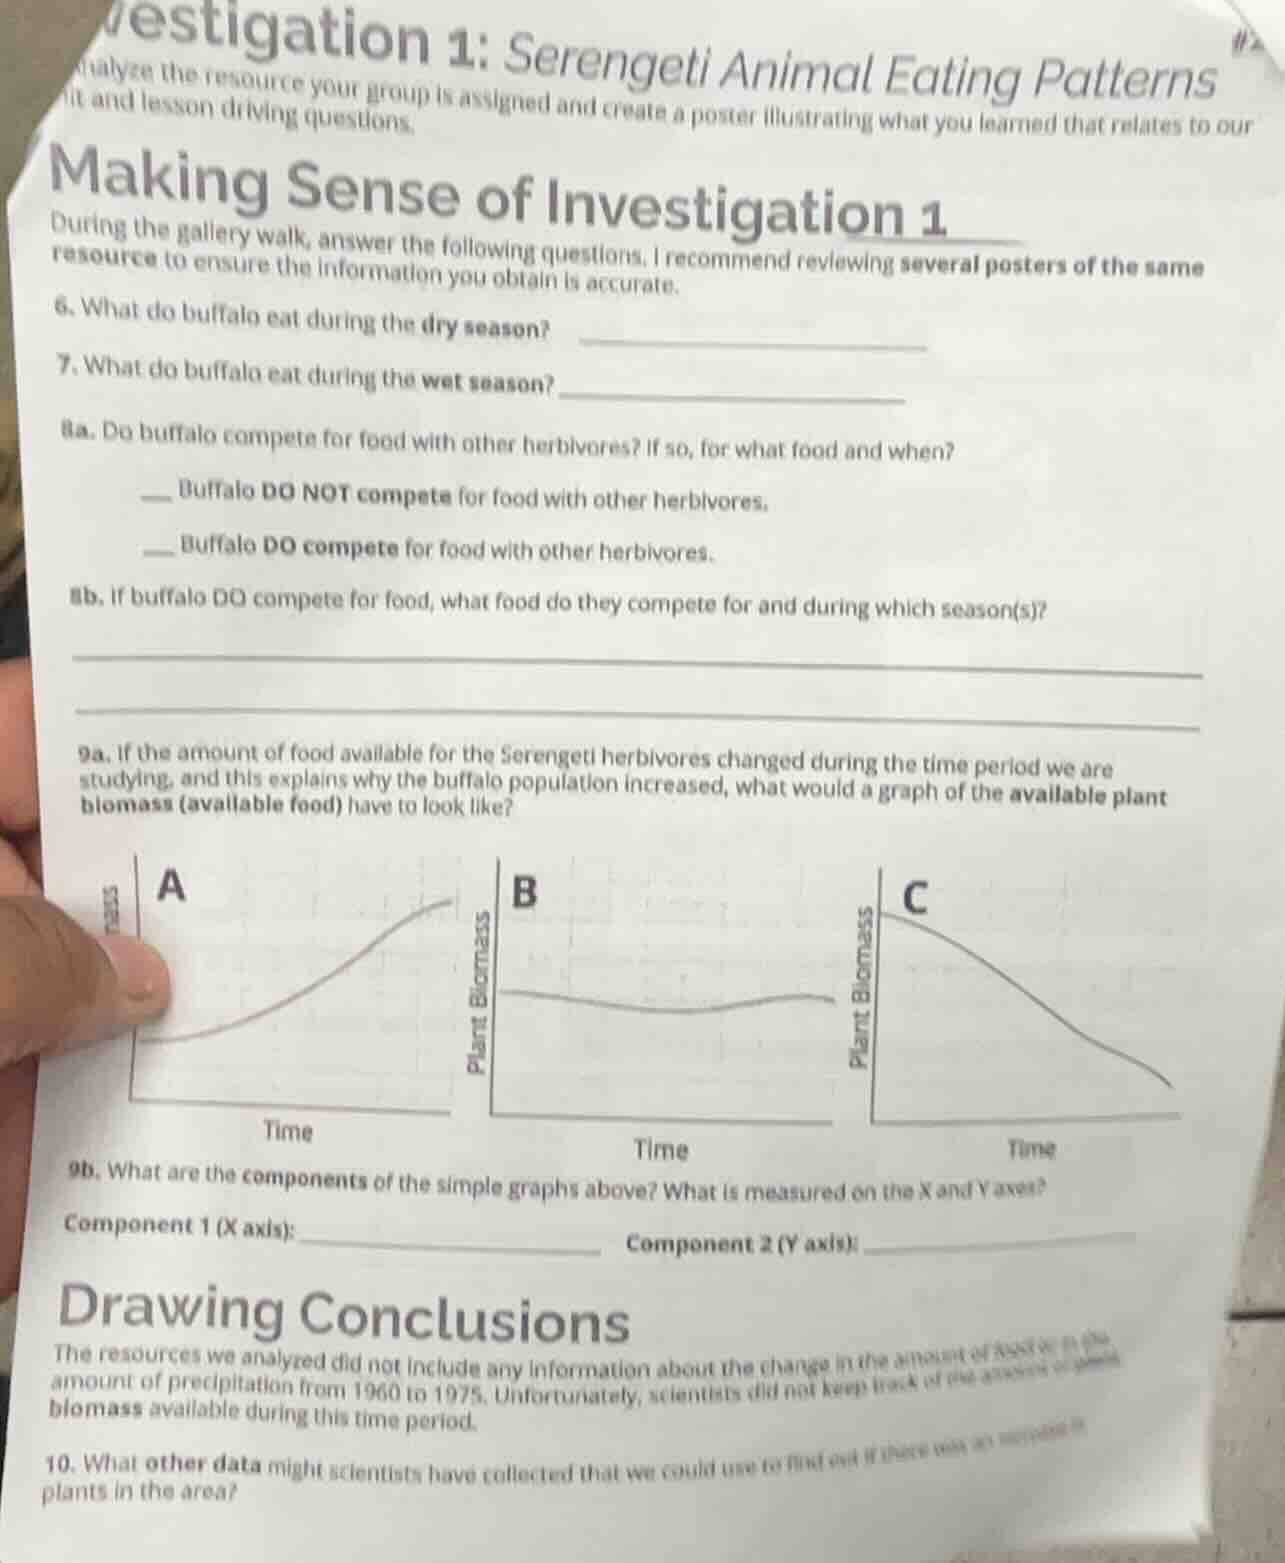
9a. if the amount of food available for the serengeti herbivores changed during the time period we are studying, and this explains why the buffalo population increased, what would a graph of the available plant biomass (available food) have to look like?
9b. what are the components of the simple graphs above? what is measured on the x and y axes?
component 1 (x axis): component 2 (y axis):
drawing conclusions
the resources we analyzed did not include any information about the change in the amount of precipitation from 1960 to 1975. unfortunately, scientists did not keep track of the available plant biomass available during this time period.
- what other data might scientists have collected that we could use to find out if there was an increase in plants in the area?
- Based on Serengeti ecosystem data, buffalo rely on dry, tough vegetation like dried grasses, stems, and browse during the dry season when fresh growth is scarce.
- In the wet season, abundant fresh, nutrient-rich grass is available, so buffalo primarily eat new grass shoots.
8a. Buffalo do compete with other herbivores, as food resources can be limited in certain seasons.
8b. They compete for grass, particularly during the dry season when fresh grass is scarce, overlapping with grazers like zebras and wildebeest.
9a. A growing buffalo population linked to food availability requires increasing plant biomass over time, which matches Graph A.
9b. Standard ecological graphs use time as the independent variable (X-axis) and the measured biological factor (plant biomass) as the dependent variable (Y-axis).
- Precipitation data directly impacts plant growth; more rainfall typically means more plant biomass. Satellite imagery or field surveys of vegetation coverage, or soil nutrient data, could also indicate plant abundance.

Snap & solve any problem in the app
Get step-by-step solutions on Sovi AI
Photo-based solutions with guided steps
Explore more problems and detailed explanations
- Dried grasses, stems, and woody browse
- Fresh, newly grown grass shoots
8a. Buffalo DO compete for food with other herbivores.
8b. They compete for grass, primarily during the dry season.
9a. Graph A
9b. Component 1 (X axis): Time; Component 2 (Y axis): Plant Biomass
- Data on seasonal precipitation levels, satellite imagery of vegetation coverage, or field measurements of grass height/density in the Serengeti during 1960-1975.