QUESTION IMAGE
Question
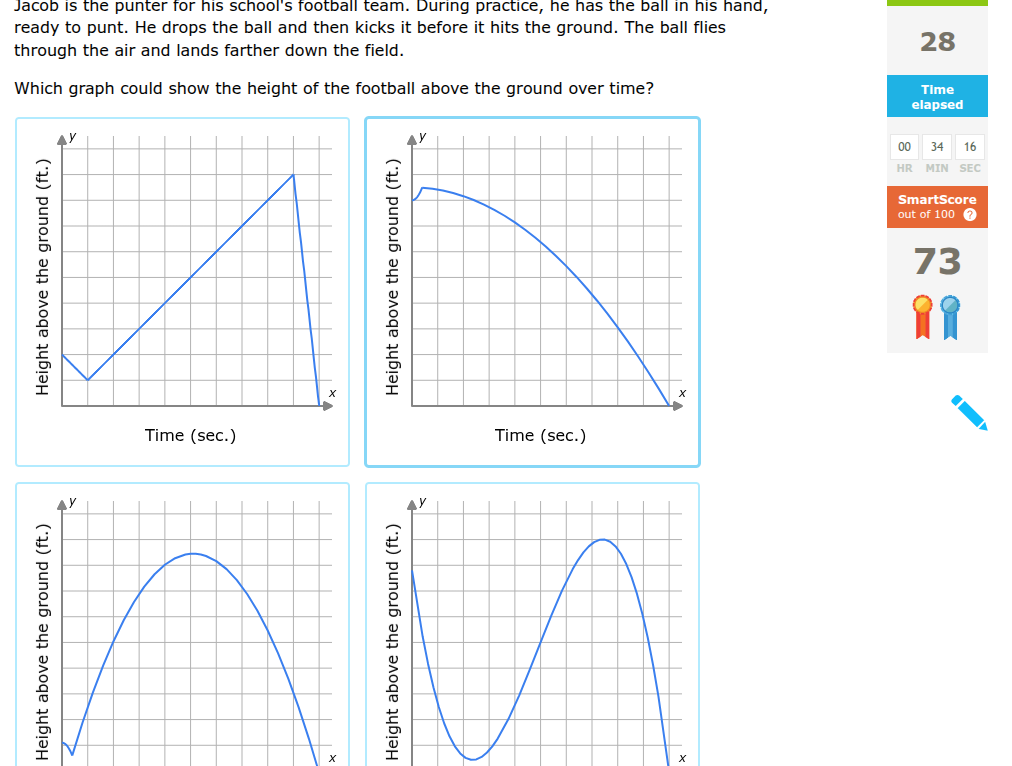
jacob is the punter for his schools football team. during practice, he has the ball in his hand, ready to punt. he drops the ball and then kicks it before it hits the ground. the ball flies through the air and lands farther down the field. which graph could show the height of the football above the ground over time?
Step1: Analyze the motion of the football
The football is initially in Jacob's hand (some height), then he drops it (height decreases slightly as it falls a bit before he kicks it), then he kicks it, so the height should first have a small drop (from his hand to just before kick), then increase to a peak, then decrease as it lands. Wait, no—wait, when he drops the ball, does he drop it and then kick it before it hits the ground. So initial state: ball in hand (height \( h_1 \)). Then he drops it: height decreases to \( h_2 \) (but not to ground). Then he kicks it: so after the drop, he kicks, so the height should then rise to a maximum (parabolic path, since projectile motion) and then fall to the ground. Wait, but let's think about the graphs.
First, let's eliminate graphs:
- Top-left: has a sharp peak and then a drop, but the motion after kick should be a parabola (smooth curve), not a sharp angle. So top-left is out.
- Top-right: starts with a small peak, then curve? No, initial height: when he has the ball in hand, then drops it (so initial height, then a small drop), then kick. Wait, maybe I misread. Wait, the problem: "he has the ball in his hand, ready to punt. He drops the ball and then kicks it before it hits the ground." So sequence:
- Ball in hand: height \( y_0 \) (positive, not zero).
- Drops the ball: height decreases (since he drops it, so it falls a bit) to \( y_1 < y_0 \), but still above ground.
- Then kicks it: so after the drop, he kicks, so the height should then increase (since kick gives upward velocity) to a maximum, then decrease (due to gravity) until it lands (height 0).
Now let's look at the graphs:
- Bottom-left: starts with a small dip (drop), then rises to a peak, then falls. That matches: initial height (starts at some y, then dips (drop), then kick makes it rise, peak, fall.
- Bottom-right: starts high, drops to near zero, then rises. But he drops it before kicking, not after letting it hit the ground. So bottom-right is out (since it goes to near zero, implying it hit the ground, but he kicks before it hits).
- Top-right: starts with a small peak, then curve. Doesn't have the initial drop.
- Top-left: has sharp angles, not a smooth parabola after kick.
So the bottom-left graph (the one with a small dip at the start, then a peak, then fall) should be the correct one. Wait, but let's re-examine the problem statement: "he drops the ball and then kicks it before it hits the ground". So the sequence is: hold (height \( h \)) → drop (height decreases to \( h' < h \), still above ground) → kick (so velocity upward, so height increases to max, then decreases to ground). So the graph should show:
- Initial height (y-axis intercept, not zero).
- Then a small decrease (drop) → then increase to peak → then decrease to zero.
Looking at the four graphs:
- Top-left: has a sharp V dip, then rises, then sharp peak, then drop. Not smooth after kick (should be parabola).
- Top-right: starts with a small peak, then curve down. No initial drop.
- Bottom-left: starts with a small dip (drop), then rises to a smooth peak (parabola), then falls. This matches: initial height (starts at some y, dips (drop), then kick makes it rise, peak, fall.
- Bottom-right: starts high, drops to near zero (hits ground), then rises. But he kicks before it hits ground, so this is out.
So the correct graph is the bottom-left one (third graph, bottom row left). Wait, but the user's image: let's confirm the positions. The four graphs:
- Top row: left and right.
- Bottom row: left and right.
So bottom-left (third g…

Snap & solve any problem in the app
Get step-by-step solutions on Sovi AI
Photo-based solutions with guided steps
Explore more problems and detailed explanations
The graph in the bottom - left (the one with a small initial dip, then a parabolic rise to a peak, and then a parabolic fall) shows the height of the football above the ground over time. (If we need to identify by position, assuming the bottom - left is the third graph when numbered top - left (1), top - right (2), bottom - left (3), bottom - right (4), then the answer is the bottom - left graph (graph 3).)