QUESTION IMAGE
Question
javier and ercilia are supervisors at a shopping mall. each was given the task of estimating the mean distance that shoppers live from the mall. they each randomly surveyed 100 shoppers. the samples yielded the following information.
| javier | ercilia | |
|---|---|---|
| $s$ | 4.0 miles | 7.0 miles |
(a) how can you determine which survey was correct?
- javier’s survey was correct because the standard deviation is less than the mean distance shoppers live from the mall
- javier’s survey was correct because the standard deviation is only 2.0 miles away from the mean distance shoppers live from the mall.
- ercilia’s survey was correct because the standard deviation is only 1.0 mile away from the mean distance shoppers live from the mall.
- ercilia’s survey was correct because the standard deviation is greater than the mean distance shoppers live from the mall.
- there is no way to determine from these numbers which survey was correct.
(b) explain what the difference in the results of the surveys implies about the data.
- the difference in the results shows that javier’s sample had a larger standard deviation than ercilia’s sample. this shows that there is not any variability in the distances that people live from the mall.
- the difference in the results shows that javier’s sample had a larger standard deviation than ercilia’s sample. this shows that, although the mean distance appears to be around 6 miles, there is probably some variability in the distances that people live from the mall.
- the difference in the results shows that javier’s sample had a smaller standard deviation than ercilia’s sample. this shows that, although the mean distance appears to be around 6 miles, there is probably some variability in the distances that people live from the mall.
- the difference in the results shows that javier’s sample had a smaller standard deviation than ercilia’s sample. this shows that there is not any variability in the distances that people live from the mall.
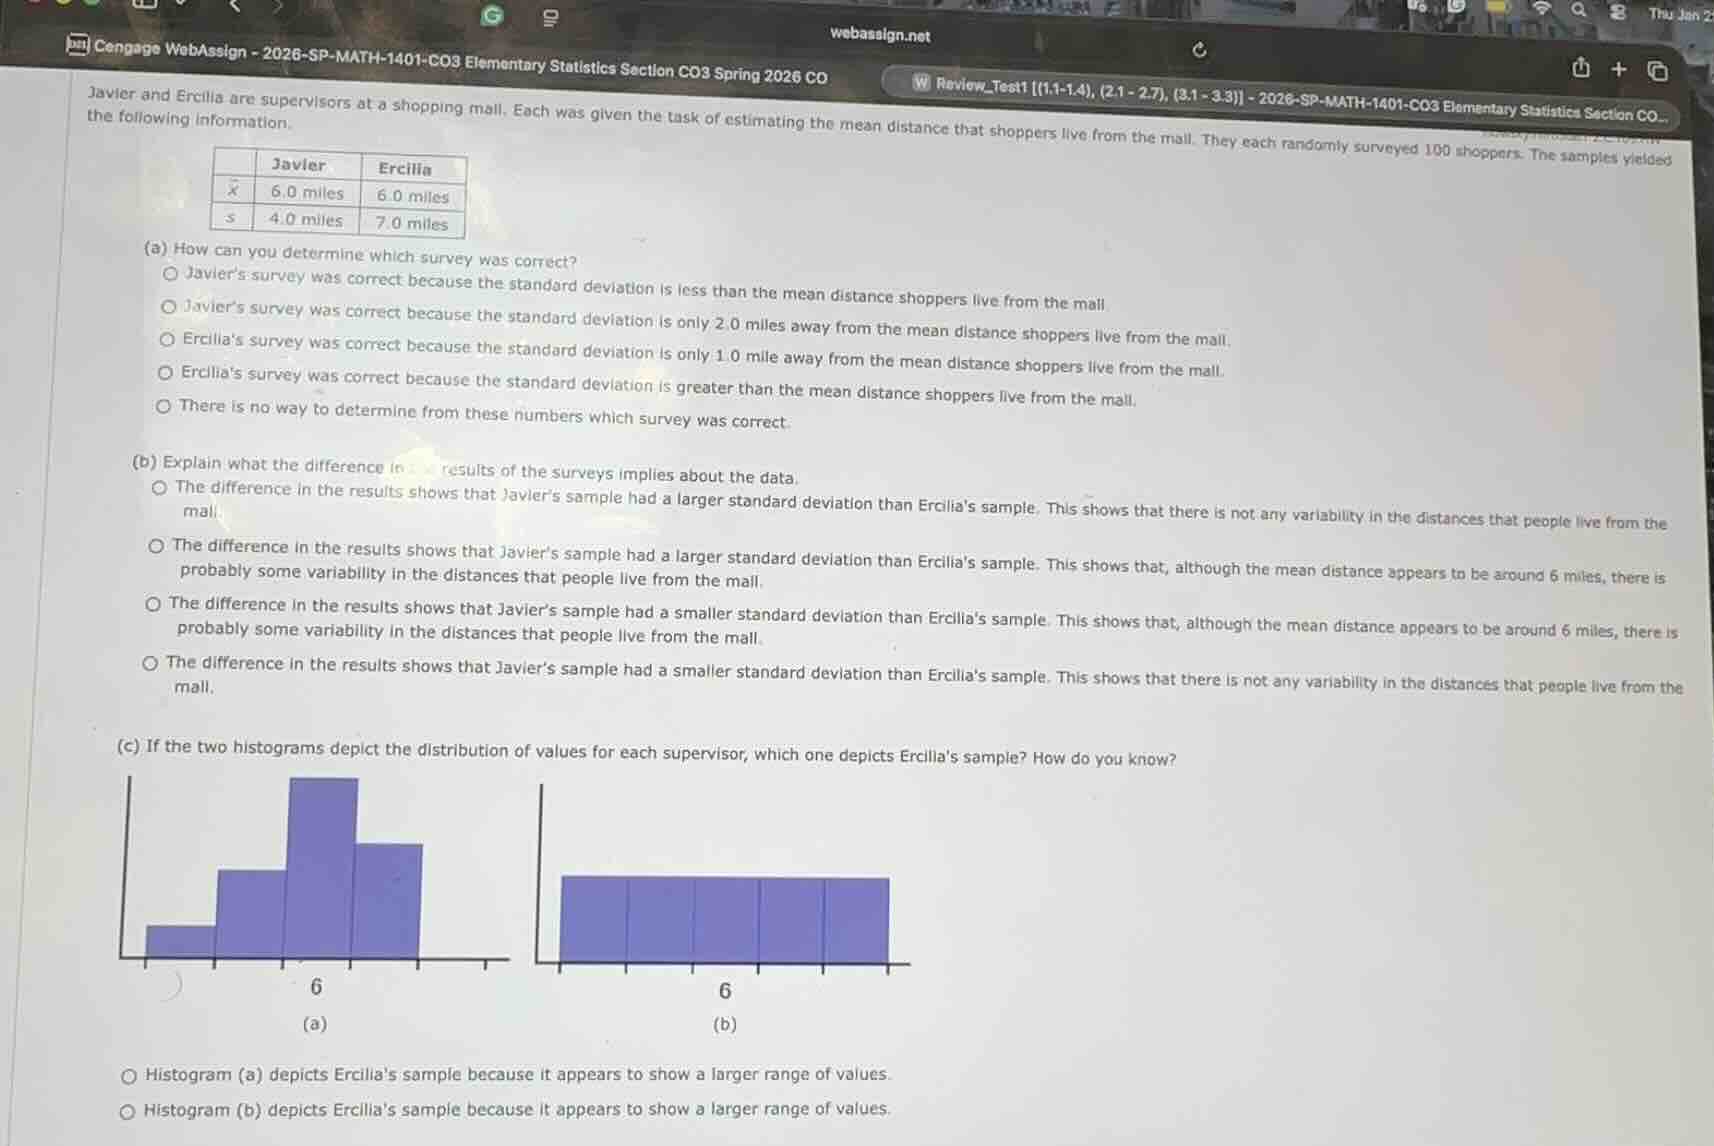
(c) if the two histograms depict the distribution of values for each supervisor, which one depicts ercilia’s sample? how do you know?
two histograms (a) and (b) are shown, (a) has a peak around 6 with varying bar heights, (b) has uniform bar heights
- histogram (a) depicts ercilia’s sample because it appears to show a larger range of values.
- histogram (b) depicts ercilia’s sample because it appears to show a larger range of values.
Part (a)
To determine which survey is correct, we analyze the options. The mean ($\bar{x}$) for both is 6.0 miles, but standard deviation ($s$) differs (Javier: 4.0, Ercilia: 7.0). Standard deviation measures variability, but these numbers alone don't indicate correctness—different samples can have same mean but different variability, and we lack population data. So no way to tell from these numbers.
Javier’s $s = 4.0$, Ercilia’s $s = 7.0$, so Javier’s standard deviation is smaller. A larger standard deviation means more variability in data. So the difference (Javier’s smaller $s$, Ercilia’s larger $s$) implies that while the mean is ~6 miles, there’s variability in distances. We check options: the correct one states Javier’s sample had smaller $s$ than Ercilia’s, showing variability.
Ercilia’s standard deviation is larger (7.0 vs. Javier’s 4.0), meaning her sample has more spread (larger range of values). Histogram (a) has a more spread-out (larger range) appearance, while (b) is more uniform/narrow. So Histogram (a) depicts Ercilia’s sample as it shows a larger range.

Snap & solve any problem in the app
Get step-by-step solutions on Sovi AI
Photo-based solutions with guided steps
Explore more problems and detailed explanations
There is no way to determine from these numbers which survey was correct.