QUESTION IMAGE
Question
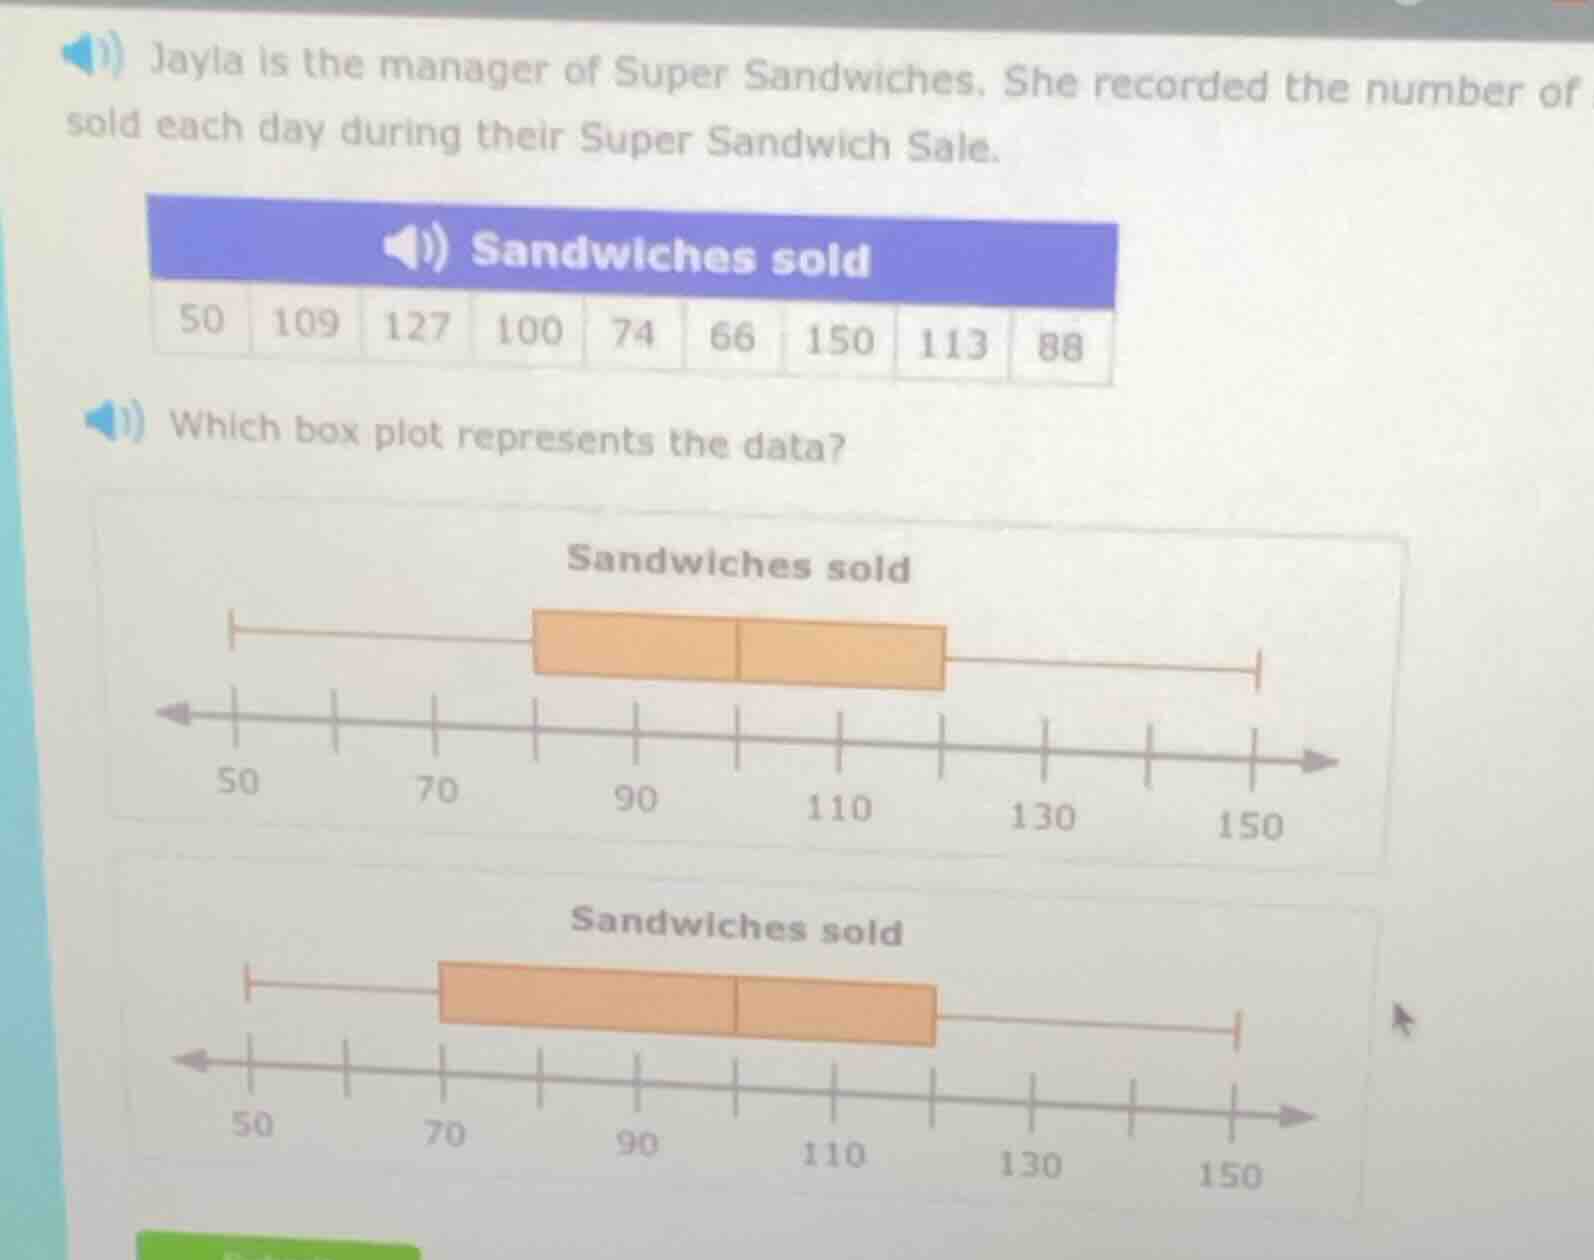
jayla is the manager of super sandwiches. she recorded the number of sold each day during their super sandwich sale.
sandwiches sold
50 109 127 100 74 66 150 113 88
which box plot represents the data?
sandwiches sold
box plot 1
sandwiches sold
box plot 2
Step1: Order the data
First, we order the data set: \(50, 66, 74, 88, 100, 109, 113, 127, 150\) (note: the original data has 9 values, so when ordered, it's these numbers).
Step2: Find the minimum, maximum, median, Q1, Q3
- Minimum: \(50\) (smallest value)
- Maximum: \(150\) (largest value)
- Median (middle value of 9 values, the 5th value): \(100\)
- Q1 (median of lower half: \(50, 66, 74, 88\); the median of these 4 values is the average of 2nd and 3rd: \(\frac{66 + 74}{2}=70\))
- Q3 (median of upper half: \(109, 113, 127, 150\); the median of these 4 values is the average of 2nd and 3rd: \(\frac{113 + 127}{2}=120\))
Step3: Analyze the box - plots
- The first box - plot: Check the whiskers (min = 50, max = 150), the box (Q1, median, Q3). The median line should be at 100, Q1 around 70, Q3 around 120. The first box - plot's whiskers start at 50 (left) and end at 150 (right), the box is between Q1 and Q3 with median at 100. The second box - plot has a left whisker that does not start at 50 (since the minimum is 50), so it's incorrect.

Snap & solve any problem in the app
Get step-by-step solutions on Sovi AI
Photo-based solutions with guided steps
Explore more problems and detailed explanations
The first box - plot (the one with left whisker starting at 50, right whisker at 150, box with median at 100, Q1 around 70 and Q3 around 120)