QUESTION IMAGE
Question
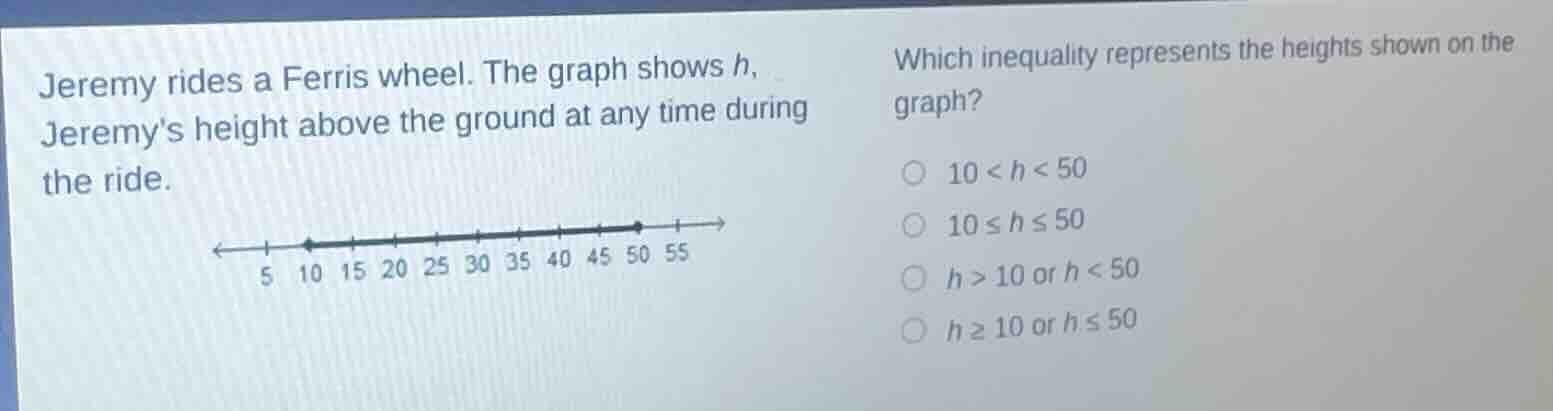
jeremy rides a ferris wheel. the graph shows h, jeremy’s height above the ground at any time during the ride.
number line from 5 to 55 with a solid dot at 10 and a solid dot at 50, and the line between them is shaded
which inequality represents the heights shown on the graph?
- $10 < h < 50$
- $10 \leq h \leq 50$
- $h > 10$ or $h < 50$
- $h \geq 10$ or $h \leq 50$
Step1: Analyze the number line
The number line has a filled - in dot at 10 and a filled - in dot at 50, and the line is between them. Filled - in dots on a number line represent that the endpoints are included in the solution set.
Step2: Determine the inequality
If the endpoints are included, the inequality should be of the form \(a\leq x\leq b\), where \(a = 10\) and \(b = 50\) in this case. So the inequality representing the heights \(h\) is \(10\leq h\leq50\).

Snap & solve any problem in the app
Get step-by-step solutions on Sovi AI
Photo-based solutions with guided steps
Explore more problems and detailed explanations
\(10\leq h\leq50\) (corresponding to the option: \(10\leq h\leq50\))