QUESTION IMAGE
Question
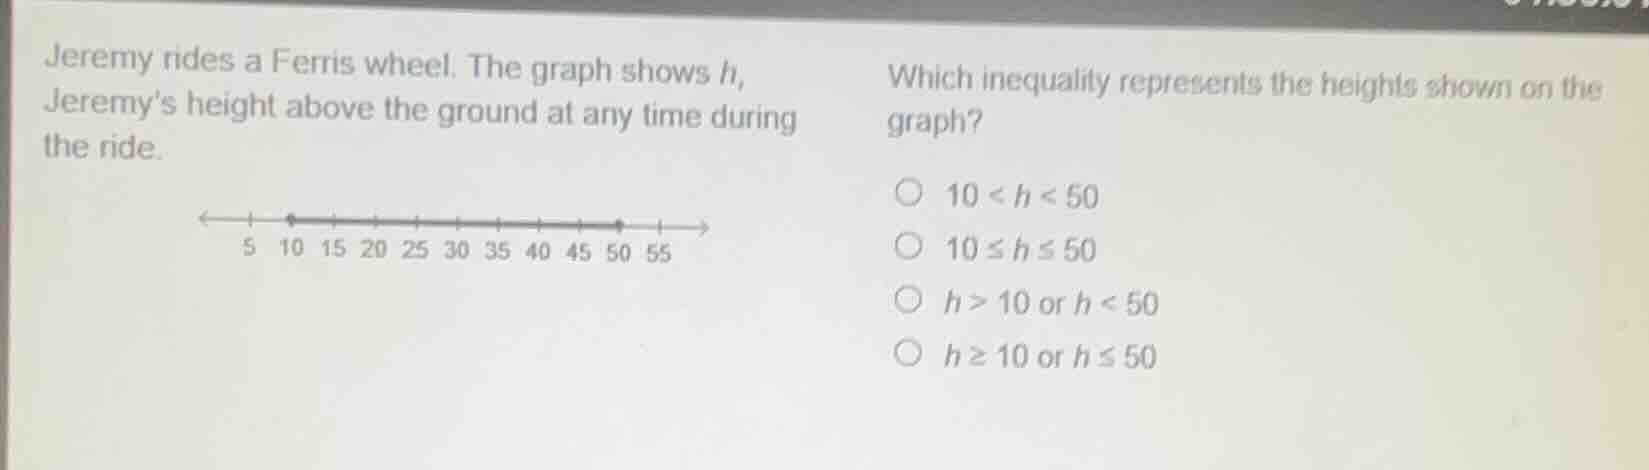
jeremy rides a ferris wheel. the graph shows h, jeremys height above the ground at any time during the ride. which inequality represents the heights shown on the graph? \bigcirc 10 < h < 50 \bigcirc 10 \leq h \leq 50 \bigcirc h > 10 or h < 50 \bigcirc h \geq 10 or h \leq 50
Step1: Analyze number line endpoints
The graph has closed dots at 10 and 50, meaning these values are included.
Step2: Analyze shaded interval
The line is shaded between 10 and 50, so heights are between these two values, including them.
Step3: Match to inequality
An inclusive range between two values is written as $10 \leq h \leq 50$.

Snap & solve any problem in the app
Get step-by-step solutions on Sovi AI
Photo-based solutions with guided steps
Explore more problems and detailed explanations
10 ≤ h ≤ 50 (Option: 10 ≤ h ≤ 50)