QUESTION IMAGE
Question
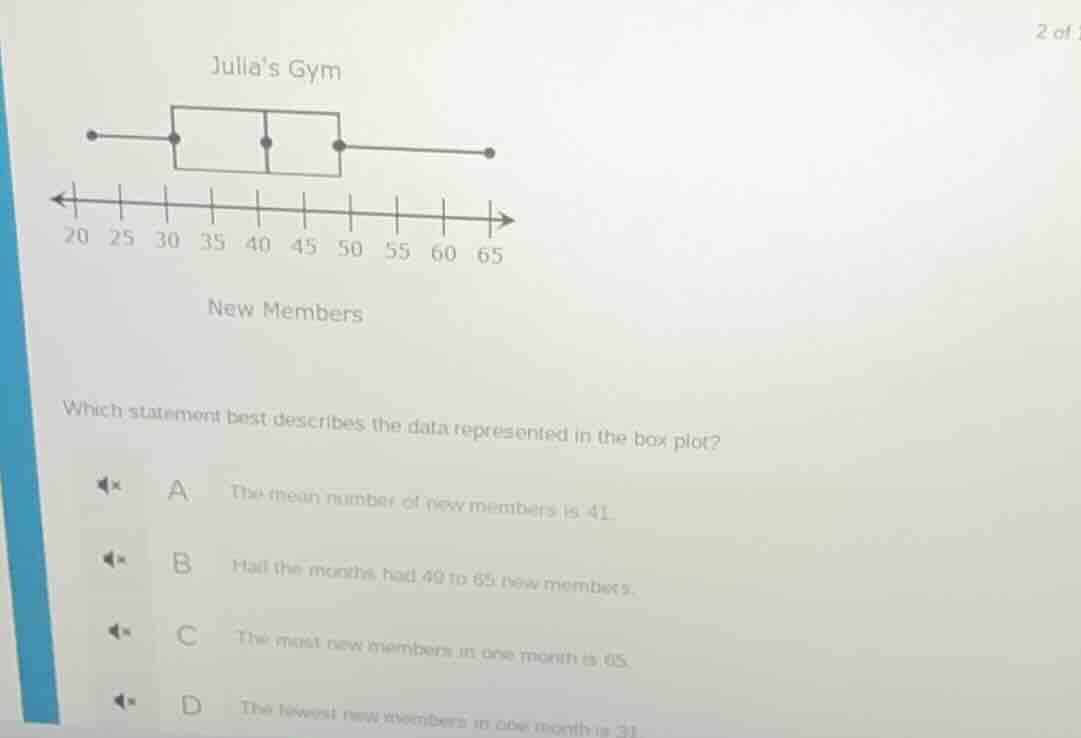
julia’s gym
new members
which statement best describes the data represented in the box plot?
a the mean number of new members is 41.
b half the months had 40 to 65 new members.
c the most new members in one month is 65.
d the fewest new members in one month is 31.
Brief Explanations
- Option A: A box plot does not directly show the mean; it displays median, quartiles, and extremes. We cannot confirm the mean is 41 from this plot.
- Option B: In a box plot, half the data lies between the minimum and median, or median and maximum—not 40 to 65. 40 is the median, 65 is the maximum, which represents the upper half of the data, not all half the months.
- Option C: The rightmost whisker endpoint is at 65, which represents the maximum value (most new members in one month).
- Option D: The leftmost whisker endpoint is at 20, which is the minimum value, not 31. 31 is the first quartile, not the lowest number of new members.

Snap & solve any problem in the app
Get step-by-step solutions on Sovi AI
Photo-based solutions with guided steps
Explore more problems and detailed explanations
C. The most new members in one month is 65.