QUESTION IMAGE
Question
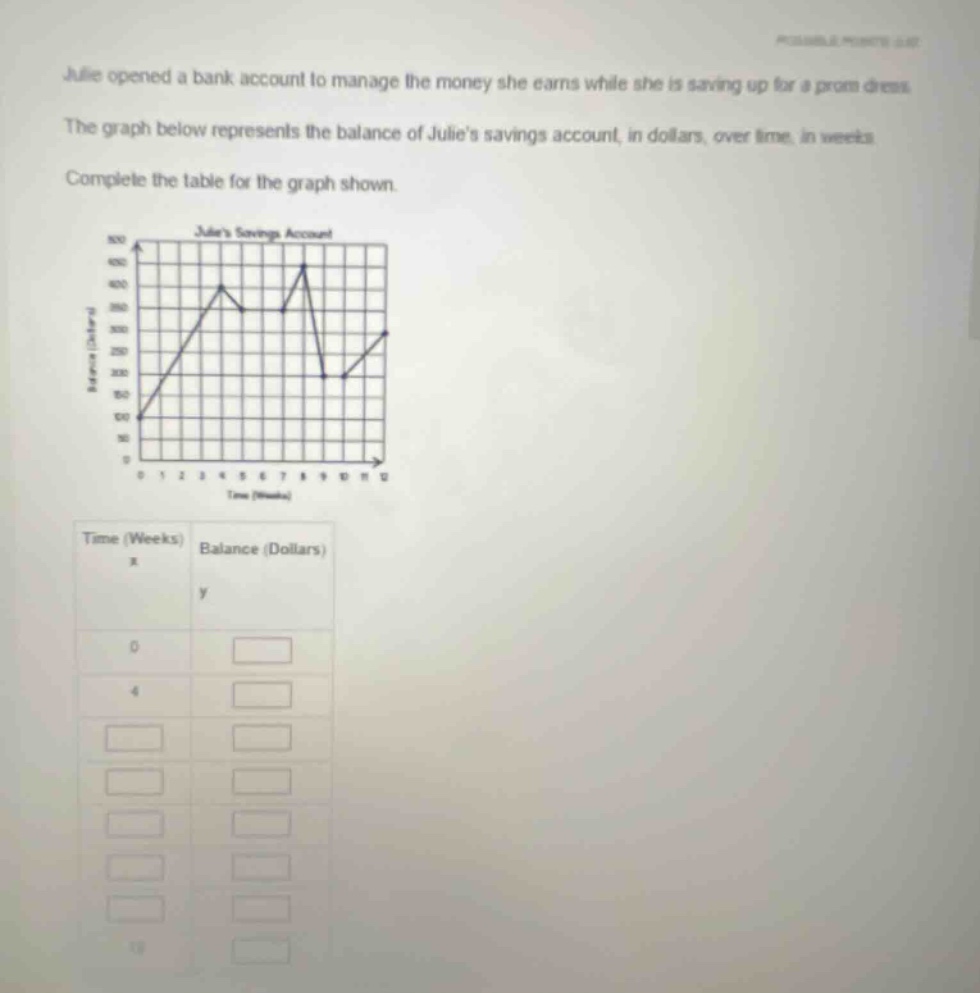
julie opened a bank account to manage the money she earns while she is saving up for a prom dress. the graph below represents the balance of julies savings account, in dollars, over time, in weeks. complete the table for the graph shown. graph of julies savings account with axes time (weeks) and balance (dollars), and a table with time (weeks) x and balance (dollars) y, with rows for x=0, x=4, and x=11, and empty boxes to fill
Step1: Analyze Time=0
At week 0 (x=0), the graph starts at the y - value of 50. So when x = 0, y=50.
Step2: Analyze Time=4
Looking at the graph, when x = 4 (week 4), the balance (y - value) is 400.
Step3: Analyze other points (example: x = 8)
At x = 8 (week 8), the balance is 450.
Step4: Analyze x = 9
At x = 9 (week 9), the balance is 100.
Step5: Analyze x = 10
At x = 10 (week 10), the balance is 100.
Step6: Analyze x = 12
At x = 12 (week 12), the balance is 300. (We can also analyze other points based on the graph's grid. For example, x = 5: y = 350; x = 6: y = 350; x = 7: y = 350 etc., but we will fill the table with the key points we can identify clearly from the graph description and the grid.)
Filling the table (partial, based on clear points):
| Time (Weeks) \( x \) | Balance (Dollars) \( y \) |
|---|---|
| 4 | 400 |
| 8 | 450 |
| 9 | 100 |
| 10 | 100 |
| 12 | 300 |
(Note: The table can be filled more comprehensively by analyzing each week's x - value and corresponding y - value from the graph's grid. For example, at x = 1 (week 1), y = 100; x = 2 (week 2), y = 200; x = 3 (week 3), y = 350; x = 5 (week 5), y = 350; x = 6 (week 6), y = 350; x = 7 (week 7), y = 350 etc. depending on the grid lines of the graph.)

Snap & solve any problem in the app
Get step-by-step solutions on Sovi AI
Photo-based solutions with guided steps
Explore more problems and detailed explanations
The table can be filled as follows (with key points):
| Time (Weeks) \( x \) | Balance (Dollars) \( y \) |
|---|---|
| 4 | 400 |
| 8 | 450 |
| 9 | 100 |
| 10 | 100 |
| 12 | 300 |
(For a more complete table, additional points can be filled by reading the graph's coordinates. For example, at x = 1, y = 100; x = 2, y = 200; x = 3, y = 350; x = 5, y = 350; x = 6, y = 350; x = 7, y = 350 etc.)