QUESTION IMAGE
Question
jump to level 1
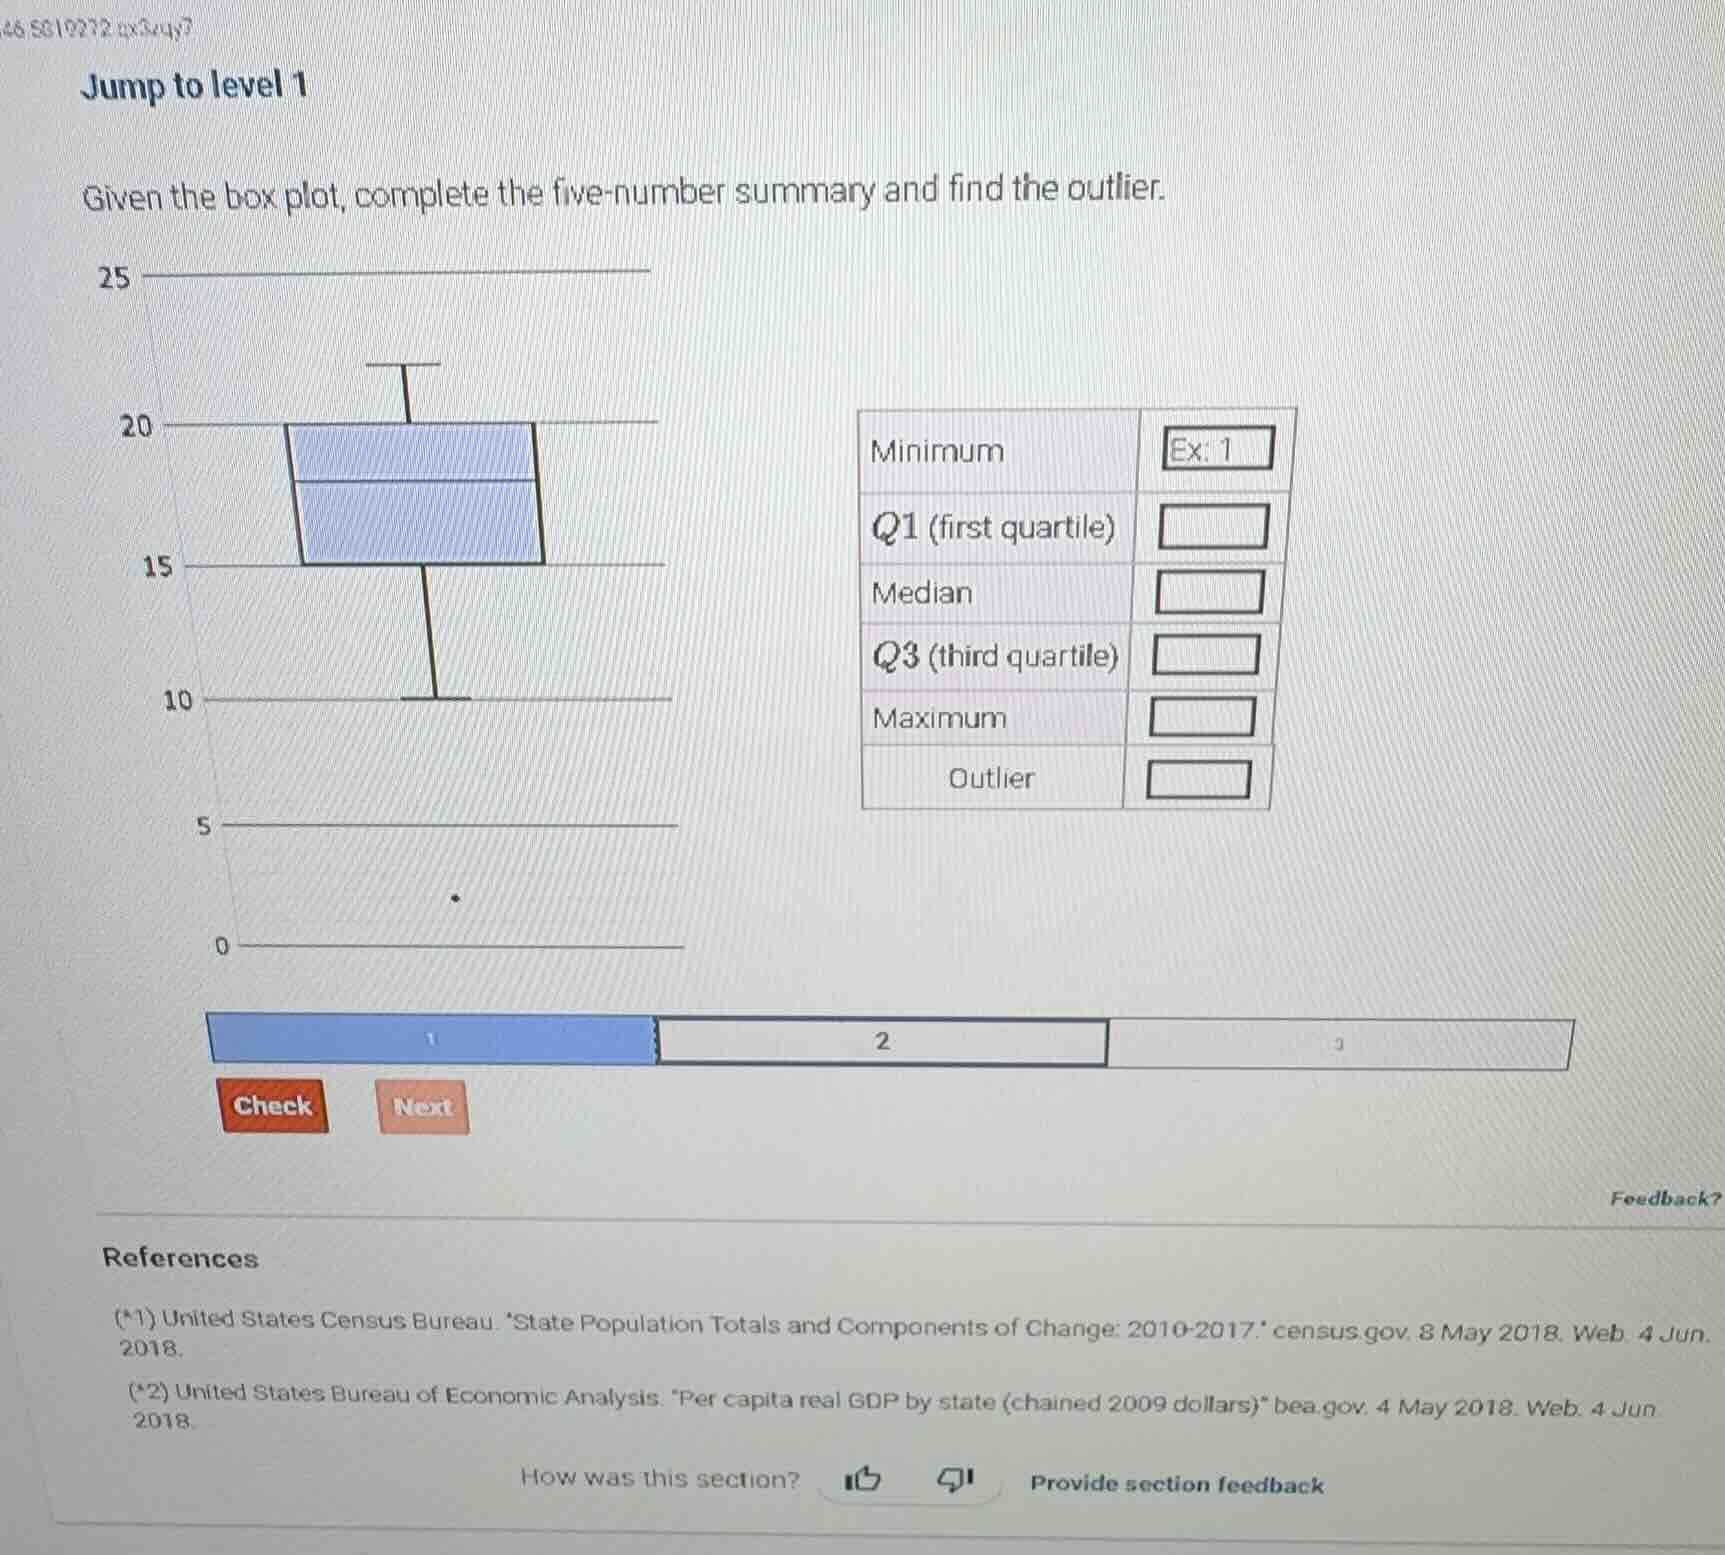
given the box plot, complete the five - number summary and find the outlier.
(box plot image and a table with minimum, q1 (first quartile), median, q3 (third quartile), maximum, outlier fields to fill)
references
(*1) united states census bureau. state population totals and components of change: 2010 - 2017. census.gov. 8 may 2018. web. 4 jun. 2018.
(*2) united states bureau of economic analysis. per capita real gdp by state (chained 2009 dollars) bea.gov. 4 may 2018. web. 4 jun 2018.
how was this section?
provide section feedback

Snap & solve any problem in the app
Get step-by-step solutions on Sovi AI
Photo-based solutions with guided steps
Explore more problems and detailed explanations
Minimum: 10
Q1 (first quartile): 15
Median: 18
Q3 (third quartile): 20
Maximum: 22
Outlier: 2