QUESTION IMAGE
Question
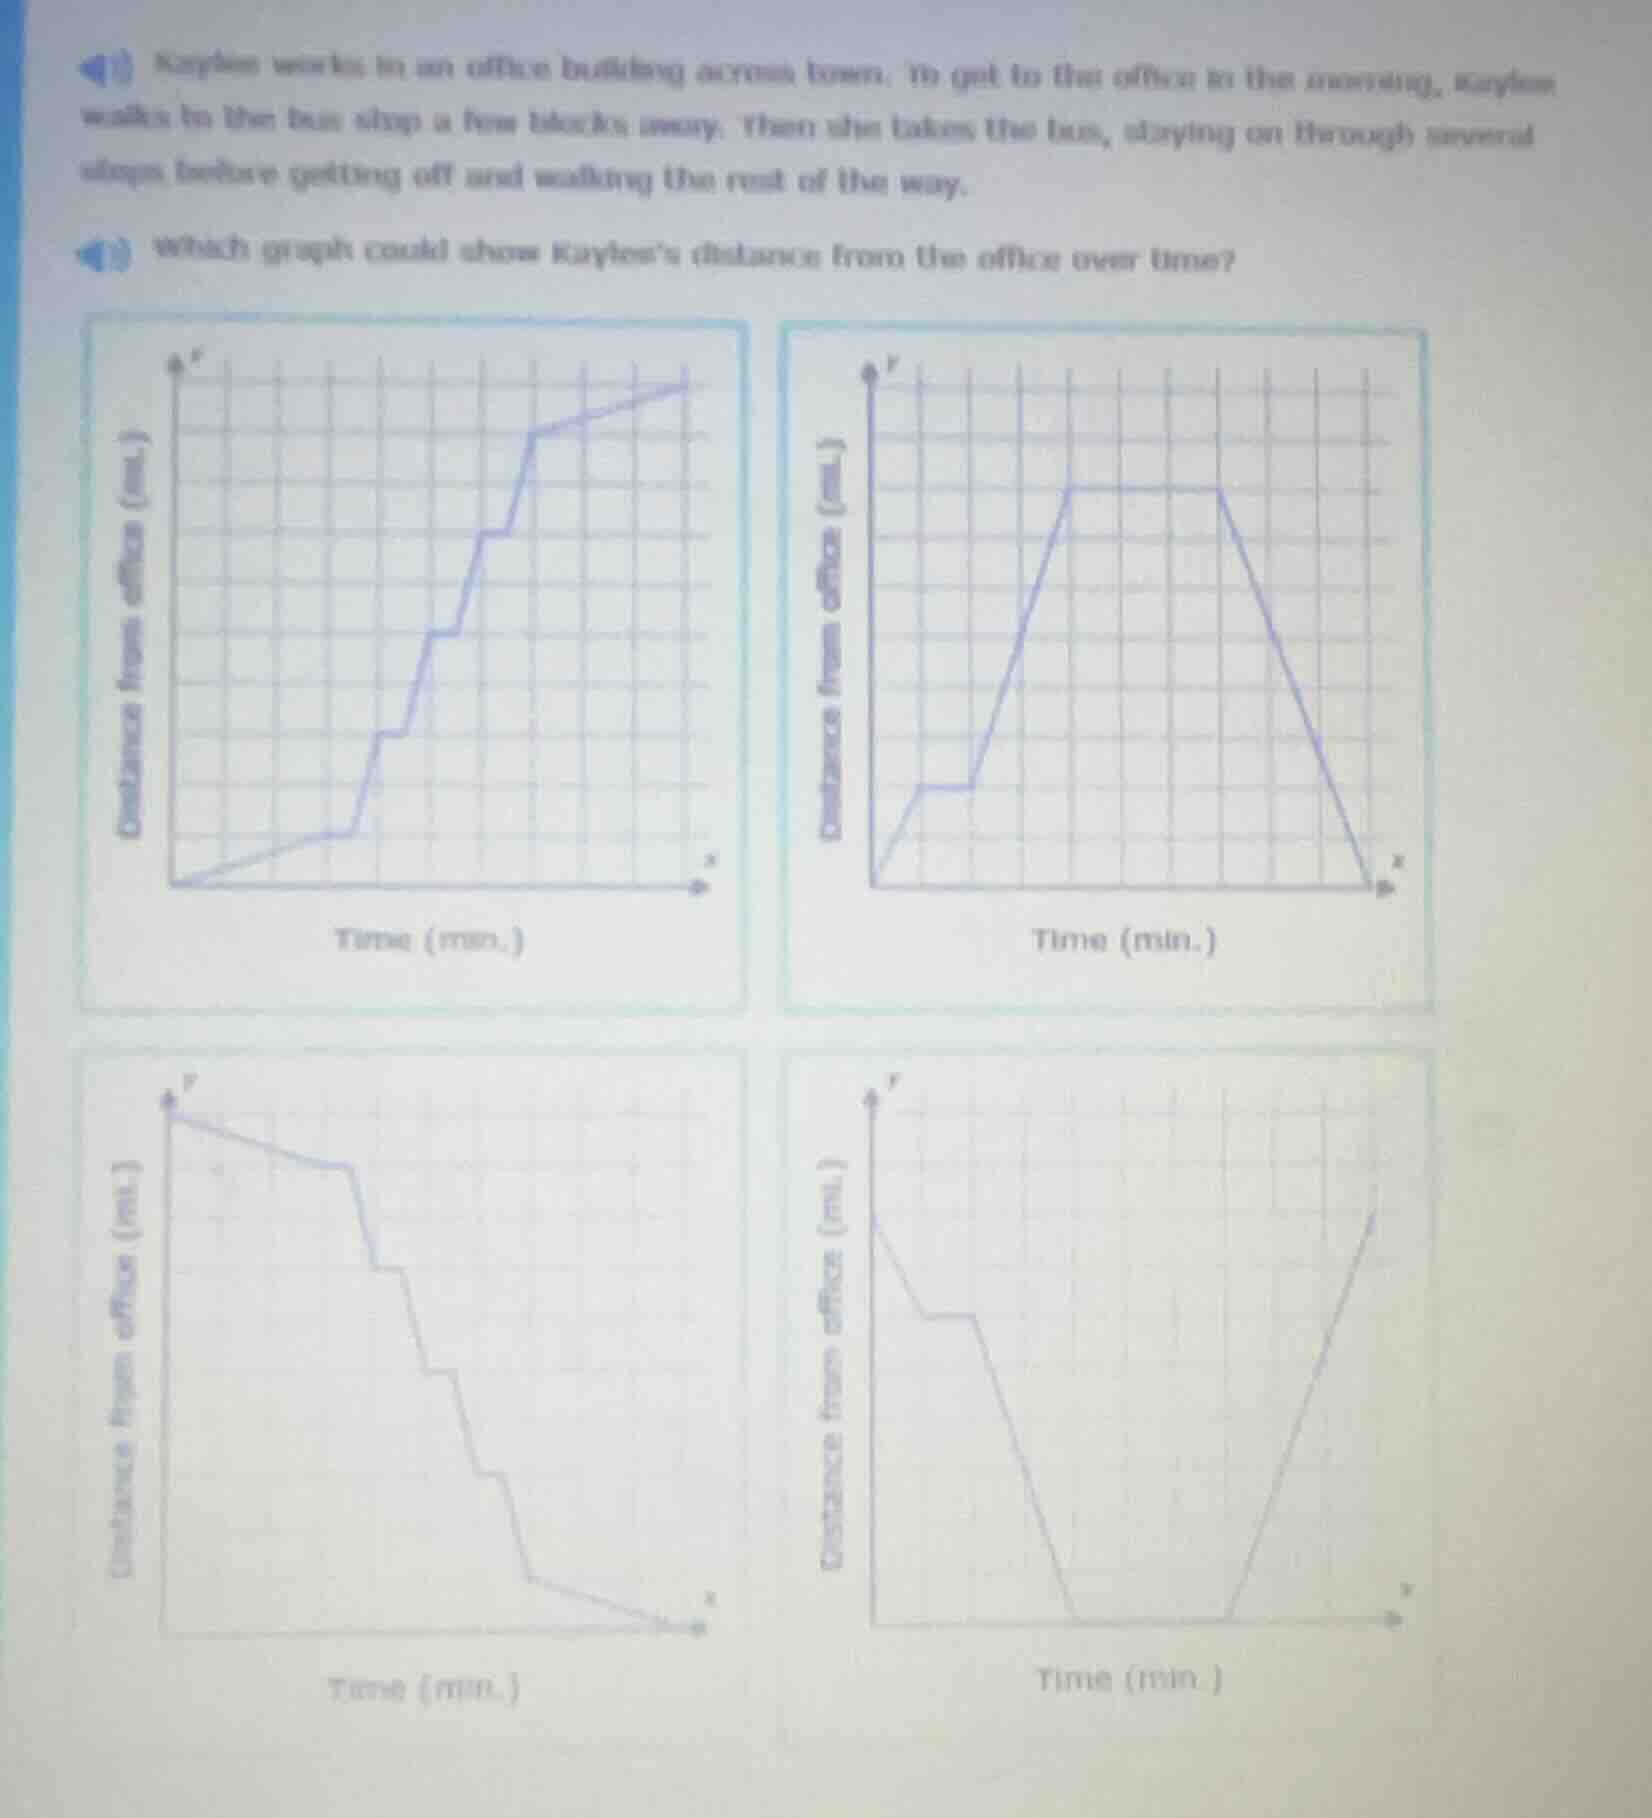
kaylee works in an office building across town. to get to that office in the morning, kaylee walks to the bus stop a few blocks away. then she takes the bus, staying on through several stops before getting off and walking the rest of the way.
which graph could show kaylee’s distance from the office over time?
- Start: Kaylee begins at home, so her distance from the office is at its maximum initial value.
- First movement: She walks to the bus stop, so her distance to the office decreases slowly over time.
- Bus ride stops: When the bus stops at several stops, her distance to the office stays constant (flat line) during each stop, and decreases quickly when the bus is moving.
- Final movement: She gets off the bus and walks the rest of the way, so her distance to the office decreases slowly until it reaches 0.
Only the bottom-left graph matches this sequence: starts at a high distance, decreases slowly, has flat segments (bus stops) interspersed with faster decreases, and ends at 0.

Snap & solve any problem in the app
Get step-by-step solutions on Sovi AI
Photo-based solutions with guided steps
Explore more problems and detailed explanations
The bottom-left graph (third graph, with a starting high distance, gradual and stepped decreases ending at 0)