QUESTION IMAGE
Question
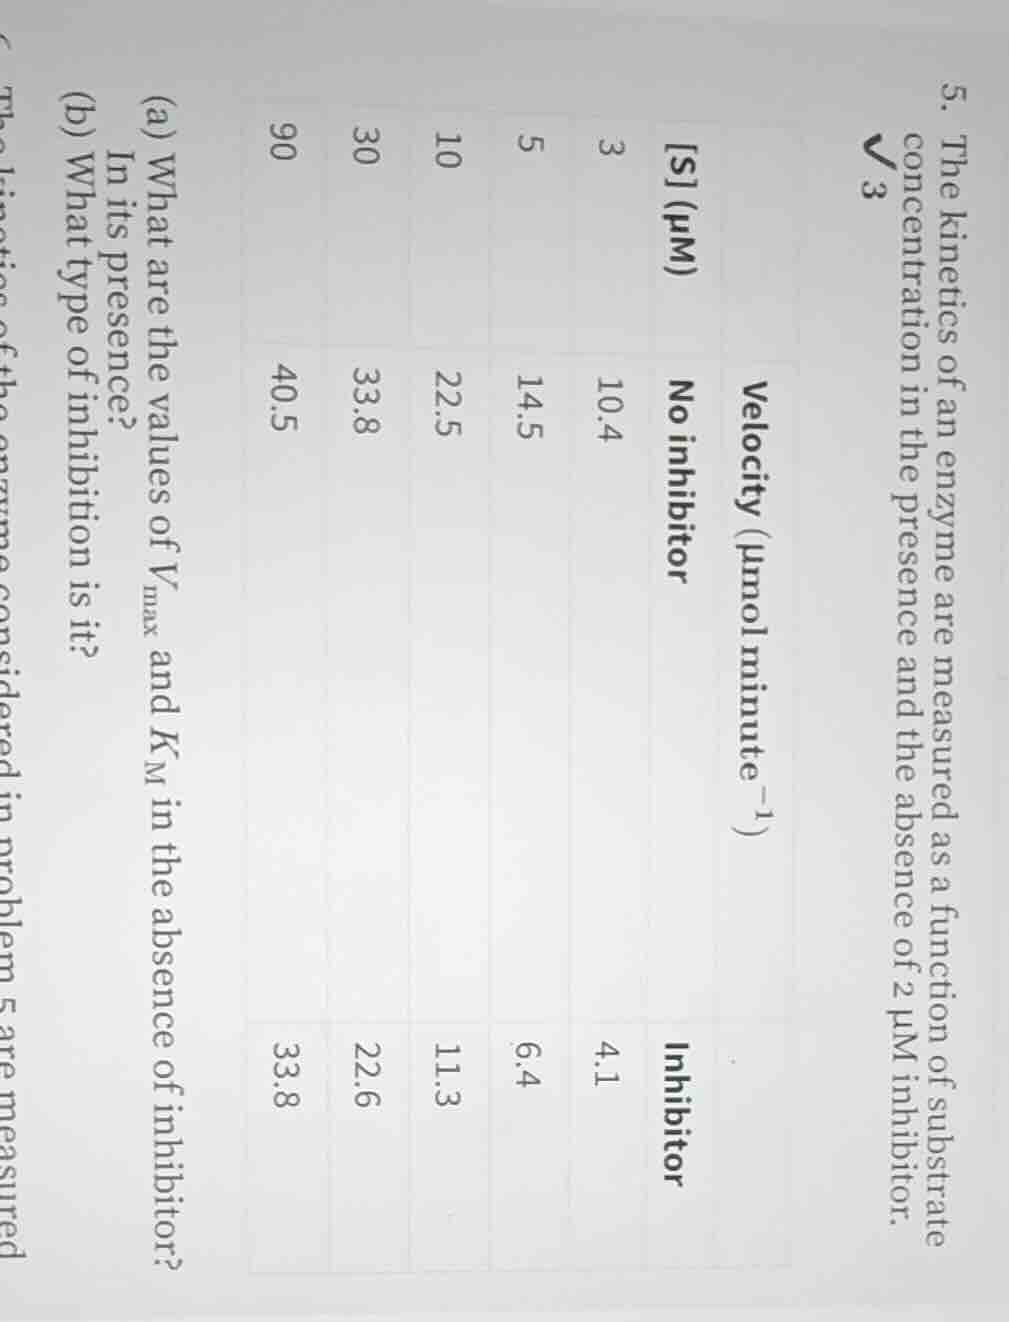
- the kinetics of an enzyme are measured as a function of substrate concentration in the presence and the absence of 2 μm inhibitor.
\\(\text{s (μm)}\\): 3, 5, 10, 30, 90
\\(\text{velocity (μmol minute}^{-1}\\))
- no inhibitor: 10.4, 14.5, 22.5, 33.8, 40.5
- inhibitor: 4.1, 6.4, 11.3, 22.6, 33.8
(a) what are the values of \\(v_{\text{max}}\\) and \\(k_{\text{m}}\\) in the absence of inhibitor? in its presence?
(b) what type of inhibition is it?
(the kinetics of the enzyme considered in problem 5 are measured)
To find \(V_{max}\) and \(K_M\), we use the Lineweaver-Burk double reciprocal plot, which rearranges the Michaelis-Menten equation to:
$$\frac{1}{v} = \frac{K_M}{V_{max}} \cdot \frac{1}{[S]} + \frac{1}{V_{max}}$$
where \(v\) is velocity, \([S]\) is substrate concentration, \(V_{max}\) is maximum velocity, and \(K_M\) is the Michaelis constant.
---
Part (a): Calculate \(V_{max}\) and \(K_M\) (no inhibitor)
Step1: Compute reciprocal values
Calculate \(\frac{1}{[S]}\) (in \(\mu M^{-1}\)) and \(\frac{1}{v}\) (in \(\text{minute } \mu mol^{-1}\)) for no inhibitor data:
| \([S]\) (\(\mu M\)) | \(v\) (\(\mu mol \text{ minute}^{-1}\)) | \(\frac{1}{[S]}\) | \(\frac{1}{v}\) |
|---|---|---|---|
| 5 | 14.5 | 0.200 | 0.0690 |
| 10 | 22.5 | 0.100 | 0.0444 |
| 30 | 33.8 | 0.0333 | 0.0296 |
| 90 | 40.5 | 0.0111 | 0.0247 |
Step2: Fit line to no inhibitor data
Plot \(\frac{1}{v}\) vs \(\frac{1}{[S]}\) and calculate the line of best fit:
- The y-intercept = \(\frac{1}{V_{max}} = 0.0198 \text{ minute } \mu mol^{-1}\)
- The slope = \(\frac{K_M}{V_{max}} = 0.234 \text{ minute}\)
Step3: Solve for \(V_{max}\)
$$V_{max} = \frac{1}{\text{y-intercept}} = \frac{1}{0.0198} \approx 50.5 \mu mol \text{ minute}^{-1}$$
Step4: Solve for \(K_M\)
$$K_M = \text{slope} \times V_{max} = 0.234 \times 50.5 \approx 11.8 \mu M$$
---
Part (b): Identify inhibitor type
Step1: Compute reciprocal values for inhibitor
Calculate \(\frac{1}{[S]}\) and \(\frac{1}{v}\) for inhibitor data:
| \([S]\) (\(\mu M\)) | \(v\) (\(\mu mol \text{ minute}^{-1}\)) | \(\frac{1}{[S]}\) | \(\frac{1}{v}\) |
|---|---|---|---|
| 5 | 6.4 | 0.200 | 0.1563 |
| 10 | 11.3 | 0.100 | 0.0885 |
| 30 | 22.6 | 0.0333 | 0.0442 |
| 90 | 33.8 | 0.0111 | 0.0296 |
Step2: Fit line to inhibitor data
Plot \(\frac{1}{v}\) vs \(\frac{1}{[S]}\) for inhibitor data:
- The y-intercept = \(0.0198 \text{ minute } \mu mol^{-1}\) (same as no inhibitor)
- The slope = \(0.672 \text{ minute}\) (higher than no inhibitor)
Step3: Classify inhibition type
A shared y-intercept (same \(V_{max}\)) and increased slope (higher apparent \(K_M\)) indicates competitive inhibition, where the inhibitor binds only to the free enzyme.

Snap & solve any problem in the app
Get step-by-step solutions on Sovi AI
Photo-based solutions with guided steps
Explore more problems and detailed explanations
(a) \(V_{max} \approx 50.5 \ \mu mol \text{ minute}^{-1}\), \(K_M \approx 11.8 \ \mu M\)
(b) Competitive inhibition