QUESTION IMAGE
Question
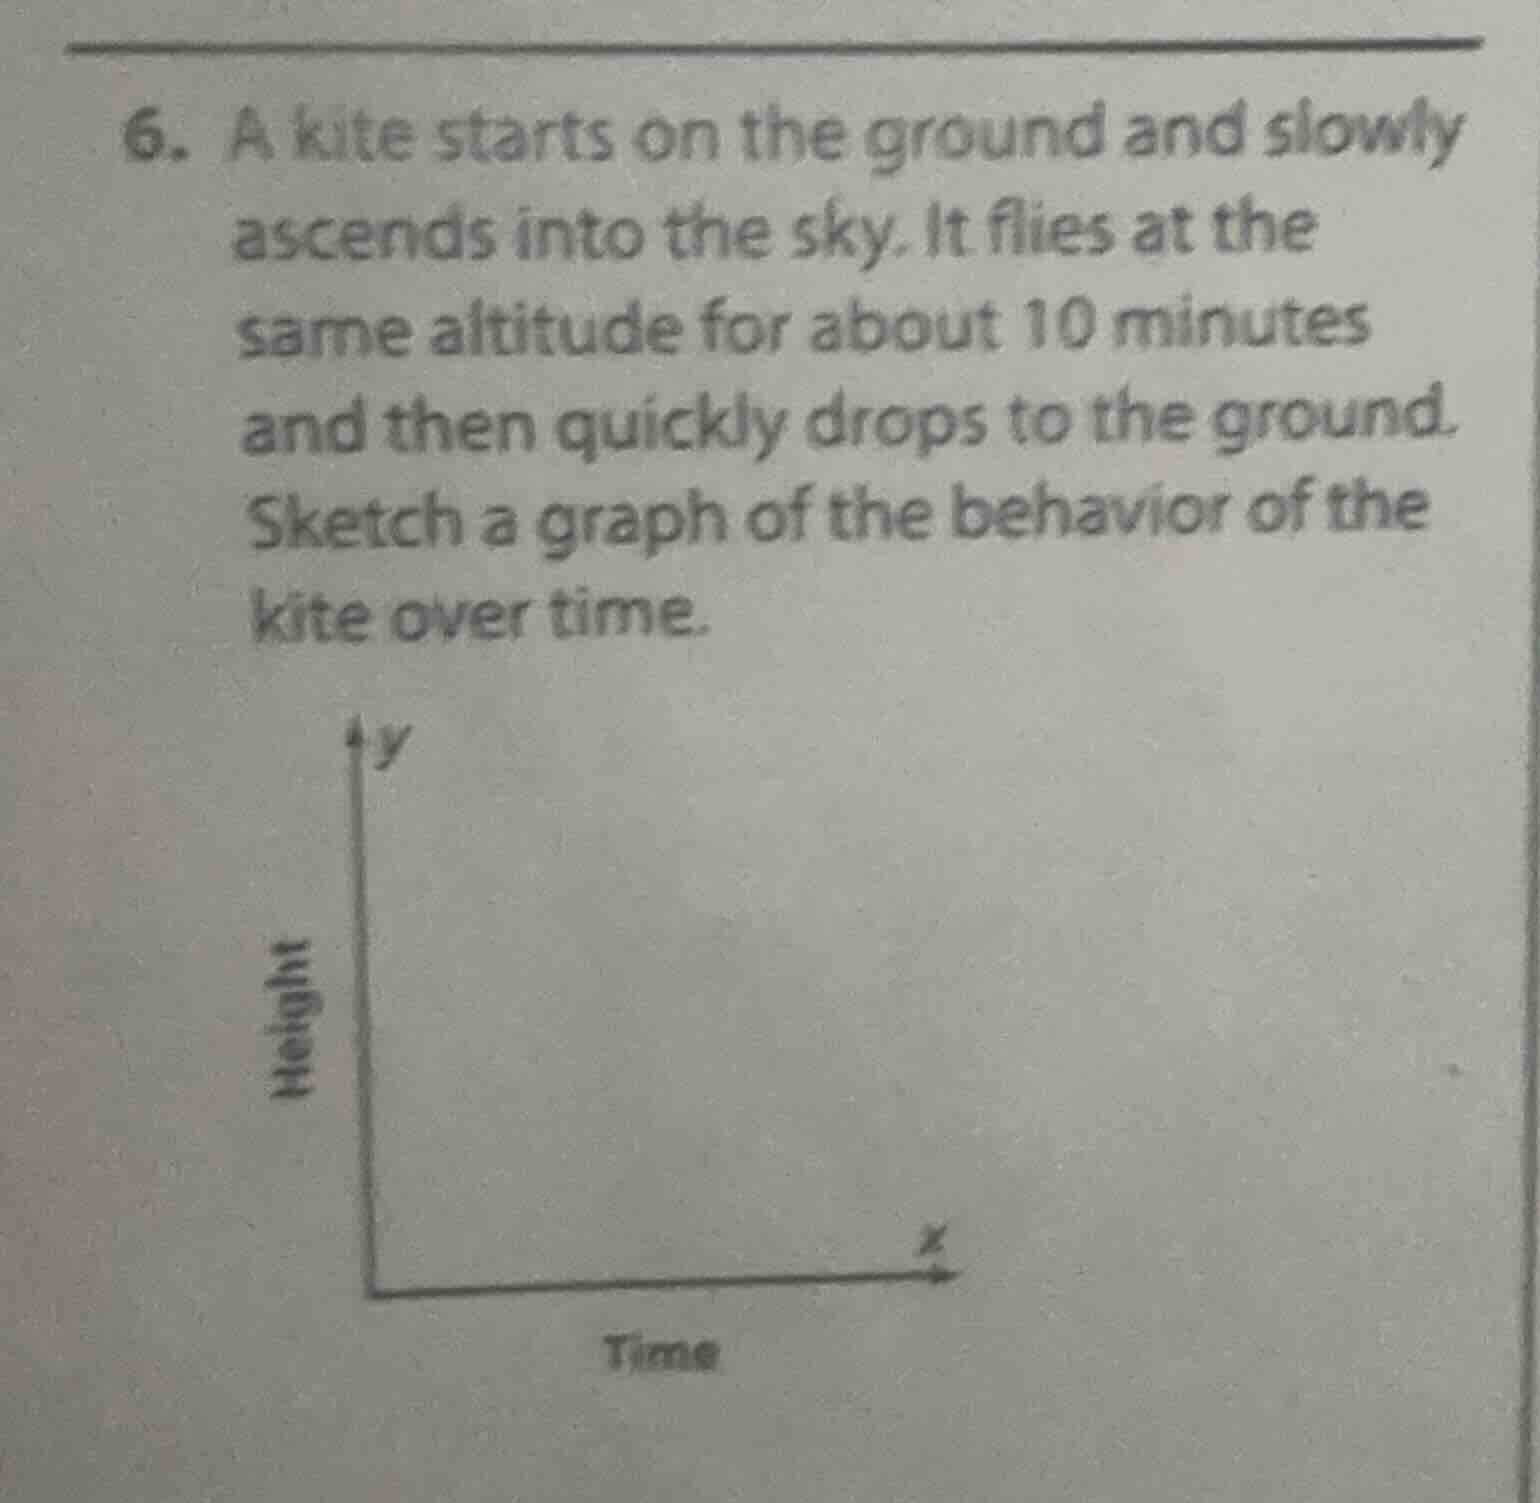
- a kite starts on the ground and slowly ascends into the sky. it flies at the same altitude for about 10 minutes and then quickly drops to the ground. sketch a graph of the behavior of the kite over time.
Step1: Define axes
x-axis = Time, y-axis = Height (starts at (0,0))
Step2: Draw ascent segment
Shallow positive slope from (0,0) to point $(t_1, h)$ where $t_1>0, h>0$ (slow climb)
Step3: Draw level segment
Horizontal line from $(t_1, h)$ to $(t_1+10, h)$ (constant altitude for 10 mins)
Step4: Draw descent segment
Steep negative slope from $(t_1+10, h)$ to $(t_2, 0)$ where $t_2 - (t_1+10) < t_1$ (quick drop to ground)

Snap & solve any problem in the app
Get step-by-step solutions on Sovi AI
Photo-based solutions with guided steps
Explore more problems and detailed explanations
The graph has three distinct segments:
- A shallow upward-sloping line starting at the origin (0,0), representing the kite's slow ascent to a constant height over time.
- A horizontal line segment lasting 10 units of time on the x-axis, representing the kite staying at a fixed altitude.
- A steep downward-sloping line from the end of the horizontal segment back to the x-axis (height = 0), representing the kite's quick descent to the ground.