QUESTION IMAGE
Question
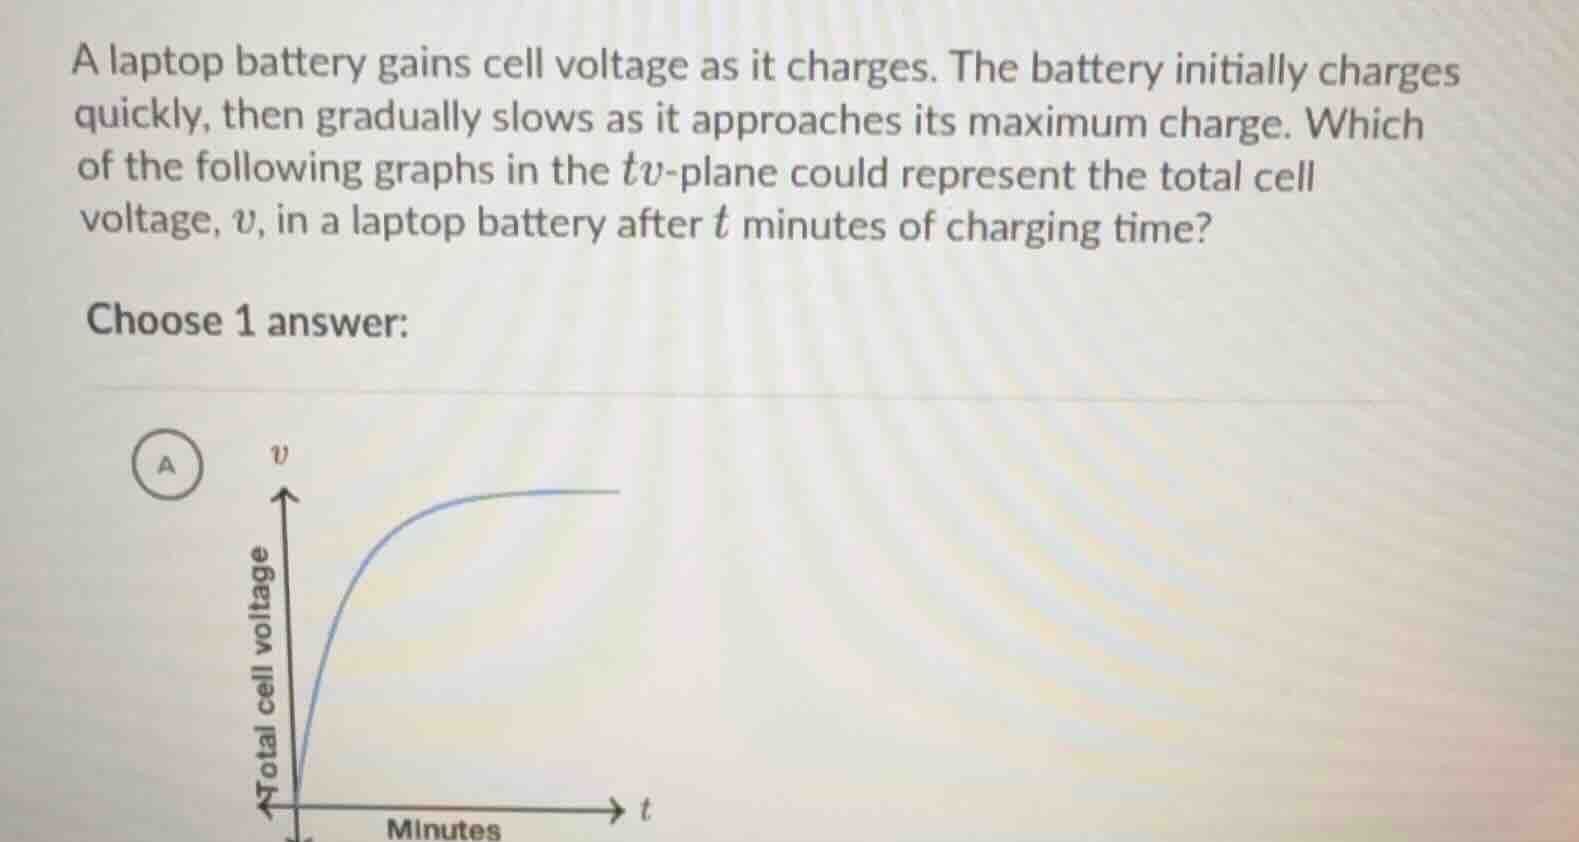
a laptop battery gains cell voltage as it charges. the battery initially charges quickly, then gradually slows as it approaches its maximum charge. which of the following graphs in the ( tv )-plane could represent the total cell voltage, ( v ), in a laptop battery after ( t ) minutes of charging time? choose 1 answer:
The problem describes a laptop battery's voltage (\(v\)) over charging time (\(t\)): it starts charging quickly (so the graph has a steeper slope initially) and then slows as it approaches maximum charge (slope becomes less steep, approaching a horizontal asymptote as \(v\) nears its maximum). The graph in option A shows an increasing function with a decreasing slope (concave down) that approaches a horizontal line, matching the battery's charging behavior. Other typical incorrect graphs might show linear (constant slope, not slowing) or decreasing/constant voltage, which don't fit.

Snap & solve any problem in the app
Get step-by-step solutions on Sovi AI
Photo-based solutions with guided steps
Explore more problems and detailed explanations
A. The graph with total cell voltage \( v \) on the y - axis, minutes \( t \) on the x - axis, showing an increasing curve with a decreasing slope (concave down) that approaches a horizontal asymptote.