QUESTION IMAGE
Question
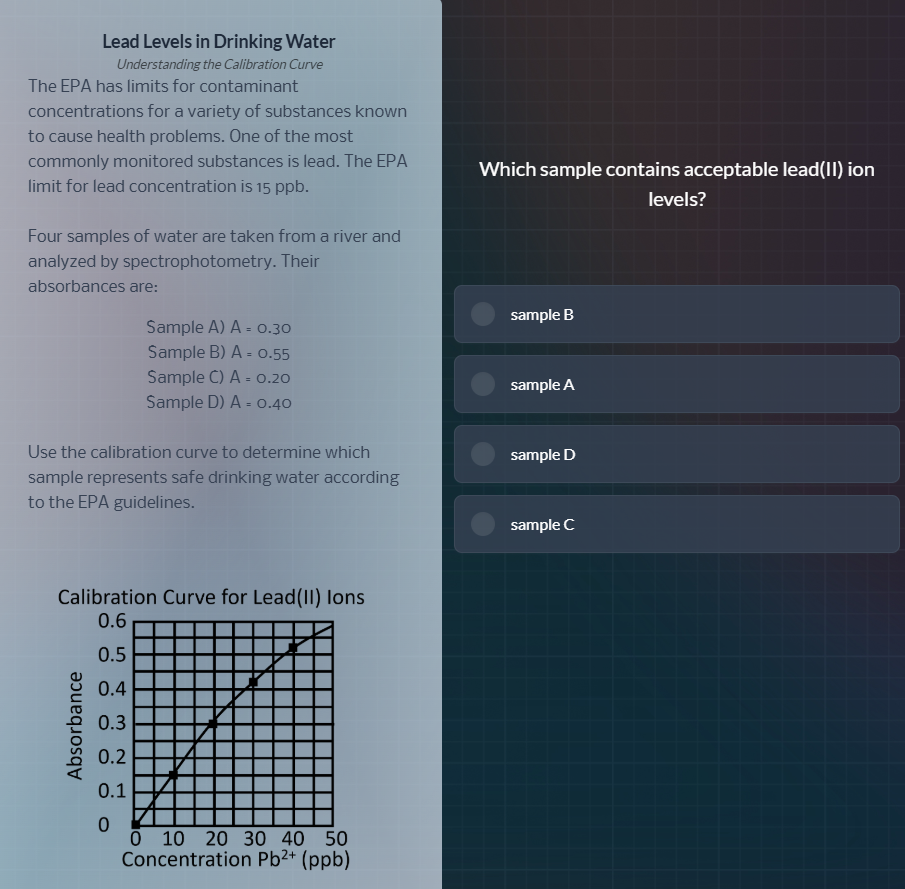
lead levels in drinking water
understanding the calibration curve
the epa has limits for contaminant
concentrations for a variety of substances known
to cause health problems. one of the most
commonly monitored substances is lead. the epa
limit for lead concentration is 15 ppb.
four samples of water are taken from a river and
analyzed by spectrophotometry. their
absorbances are:
sample a) a = 0.30
sample b) a = 0.55
sample c) a = 0.20
sample d) a = 0.40
use the calibration curve to determine which
sample represents safe drinking water according
to the epa guidelines.
calibration curve for lead(ii) ions
which sample contains acceptable lead(ii) ion
levels?
sample b
sample a
sample d
sample c
Step1: Map absorbance to concentration
From the calibration curve:
- Sample A (A=0.30): $\text{Concentration} = 20\ \text{ppb}$
- Sample B (A=0.55): $\text{Concentration} = 45\ \text{ppb}$
- Sample C (A=0.20): $\text{Concentration} = 15\ \text{ppb}$
- Sample D (A=0.40): $\text{Concentration} = 30\ \text{ppb}$
Step2: Compare to EPA limit
EPA limit = $15\ \text{ppb}$. Acceptable levels are ≤ 15 ppb.

Snap & solve any problem in the app
Get step-by-step solutions on Sovi AI
Photo-based solutions with guided steps
Explore more problems and detailed explanations
sample C