QUESTION IMAGE
Question
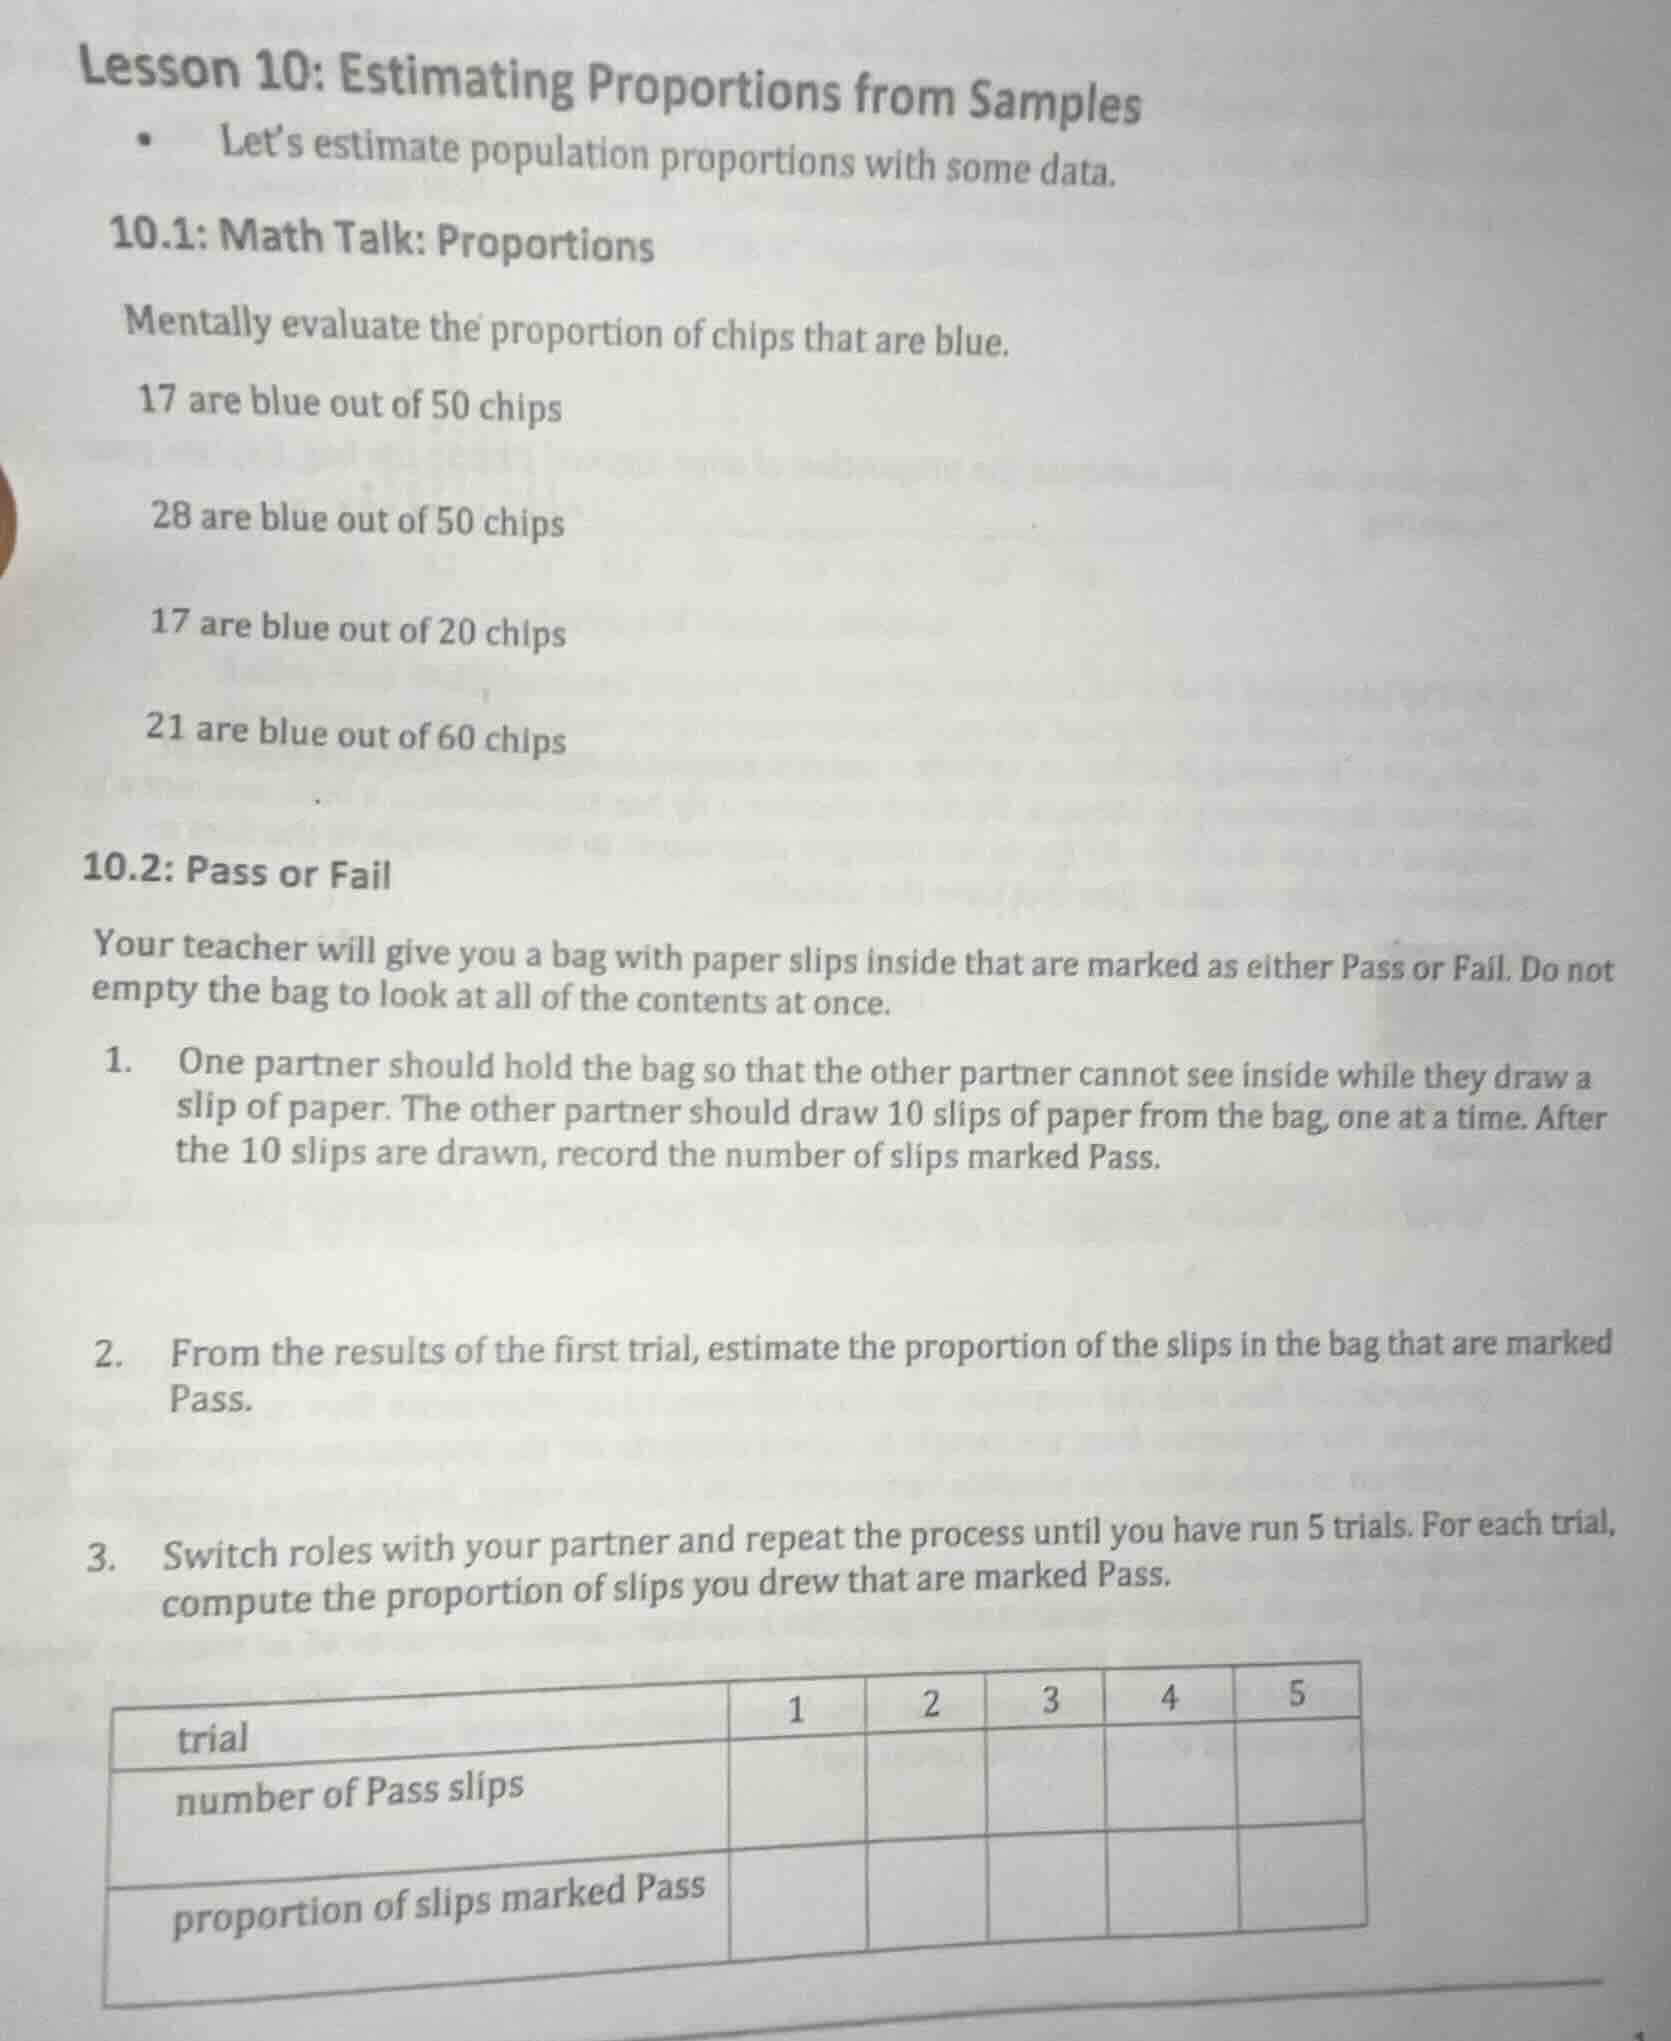
lesson 10: estimating proportions from samples• lets estimate population proportions with some data.10.1: math talk: proportionsmentally evaluate the proportion of chips that are blue.17 are blue out of 50 chips28 are blue out of 50 chips17 are blue out of 20 chips21 are blue out of 60 chips10.2: pass or failyour teacher will give you a bag with paper slips inside that are marked as either pass or fail. do not empty the bag to look at all of the contents at once.1. one partner should hold the bag so that the other partner cannot see inside while they draw a slip of paper. the other partner should draw 10 slips of paper from the bag, one at a time. after the 10 slips are drawn, record the number of slips marked pass.2. from the results of the first trial, estimate the proportion of the slips in the bag that are marked pass.3. switch roles with your partner and repeat the process until you have run 5 trials. for each trial, compute the proportion of slips you drew that are marked pass.| trial | 1 | 2 | 3 | 4 | 5 || ---- | ---- | ---- | ---- | ---- | ---- || number of pass slips | | | | | || proportion of slips marked pass | | | | | |
Step1: Calculate blue chip proportion
$\frac{17}{50}=0.34$
Step2: Calculate blue chip proportion
$\frac{28}{50}=0.56$
Step3: Calculate blue chip proportion
$\frac{17}{20}=0.85$
Step4: Calculate blue chip proportion
$\frac{21}{60}=0.35$
For 10.2 Pass or Fail (general method):
Step1: Define proportion formula
$\text{Proportion of Pass slips} = \frac{\text{Number of Pass slips drawn}}{10}$
Step2: Apply to each trial
For each trial, substitute the count of Pass slips into the formula, then fill the table.

Snap & solve any problem in the app
Get step-by-step solutions on Sovi AI
Photo-based solutions with guided steps
Explore more problems and detailed explanations
10.1 Math Talk Proportions:
- 0.34
- 0.56
- 0.85
- 0.35
10.2 Pass or Fail:
- (This is a hands-on step; record the number of Pass slips drawn in trial 1, e.g., if 6 Pass slips are drawn, record 6)
- Using the count from step 1, compute the proportion as $\frac{\text{Number of Pass slips}}{10}$ (e.g., $\frac{6}{10}=0.6$)
- Repeat steps 1-2 for 4 more trials, then fill the table as follows (example with hypothetical data):
| trial | 1 | 2 | 3 | 4 | 5 |
|---|---|---|---|---|---|
| proportion of slips marked Pass | 0.6 | 0.7 | 0.5 | 0.6 | 0.7 |
Note: Actual values depend on the results of your physical trials.