QUESTION IMAGE
Question
lesson 18 | session 2 name
practice using graphs to describe
functions qualitatively
study the example showing how to use a graph to describe
a function qualitatively. then solve problems 1-7.
example
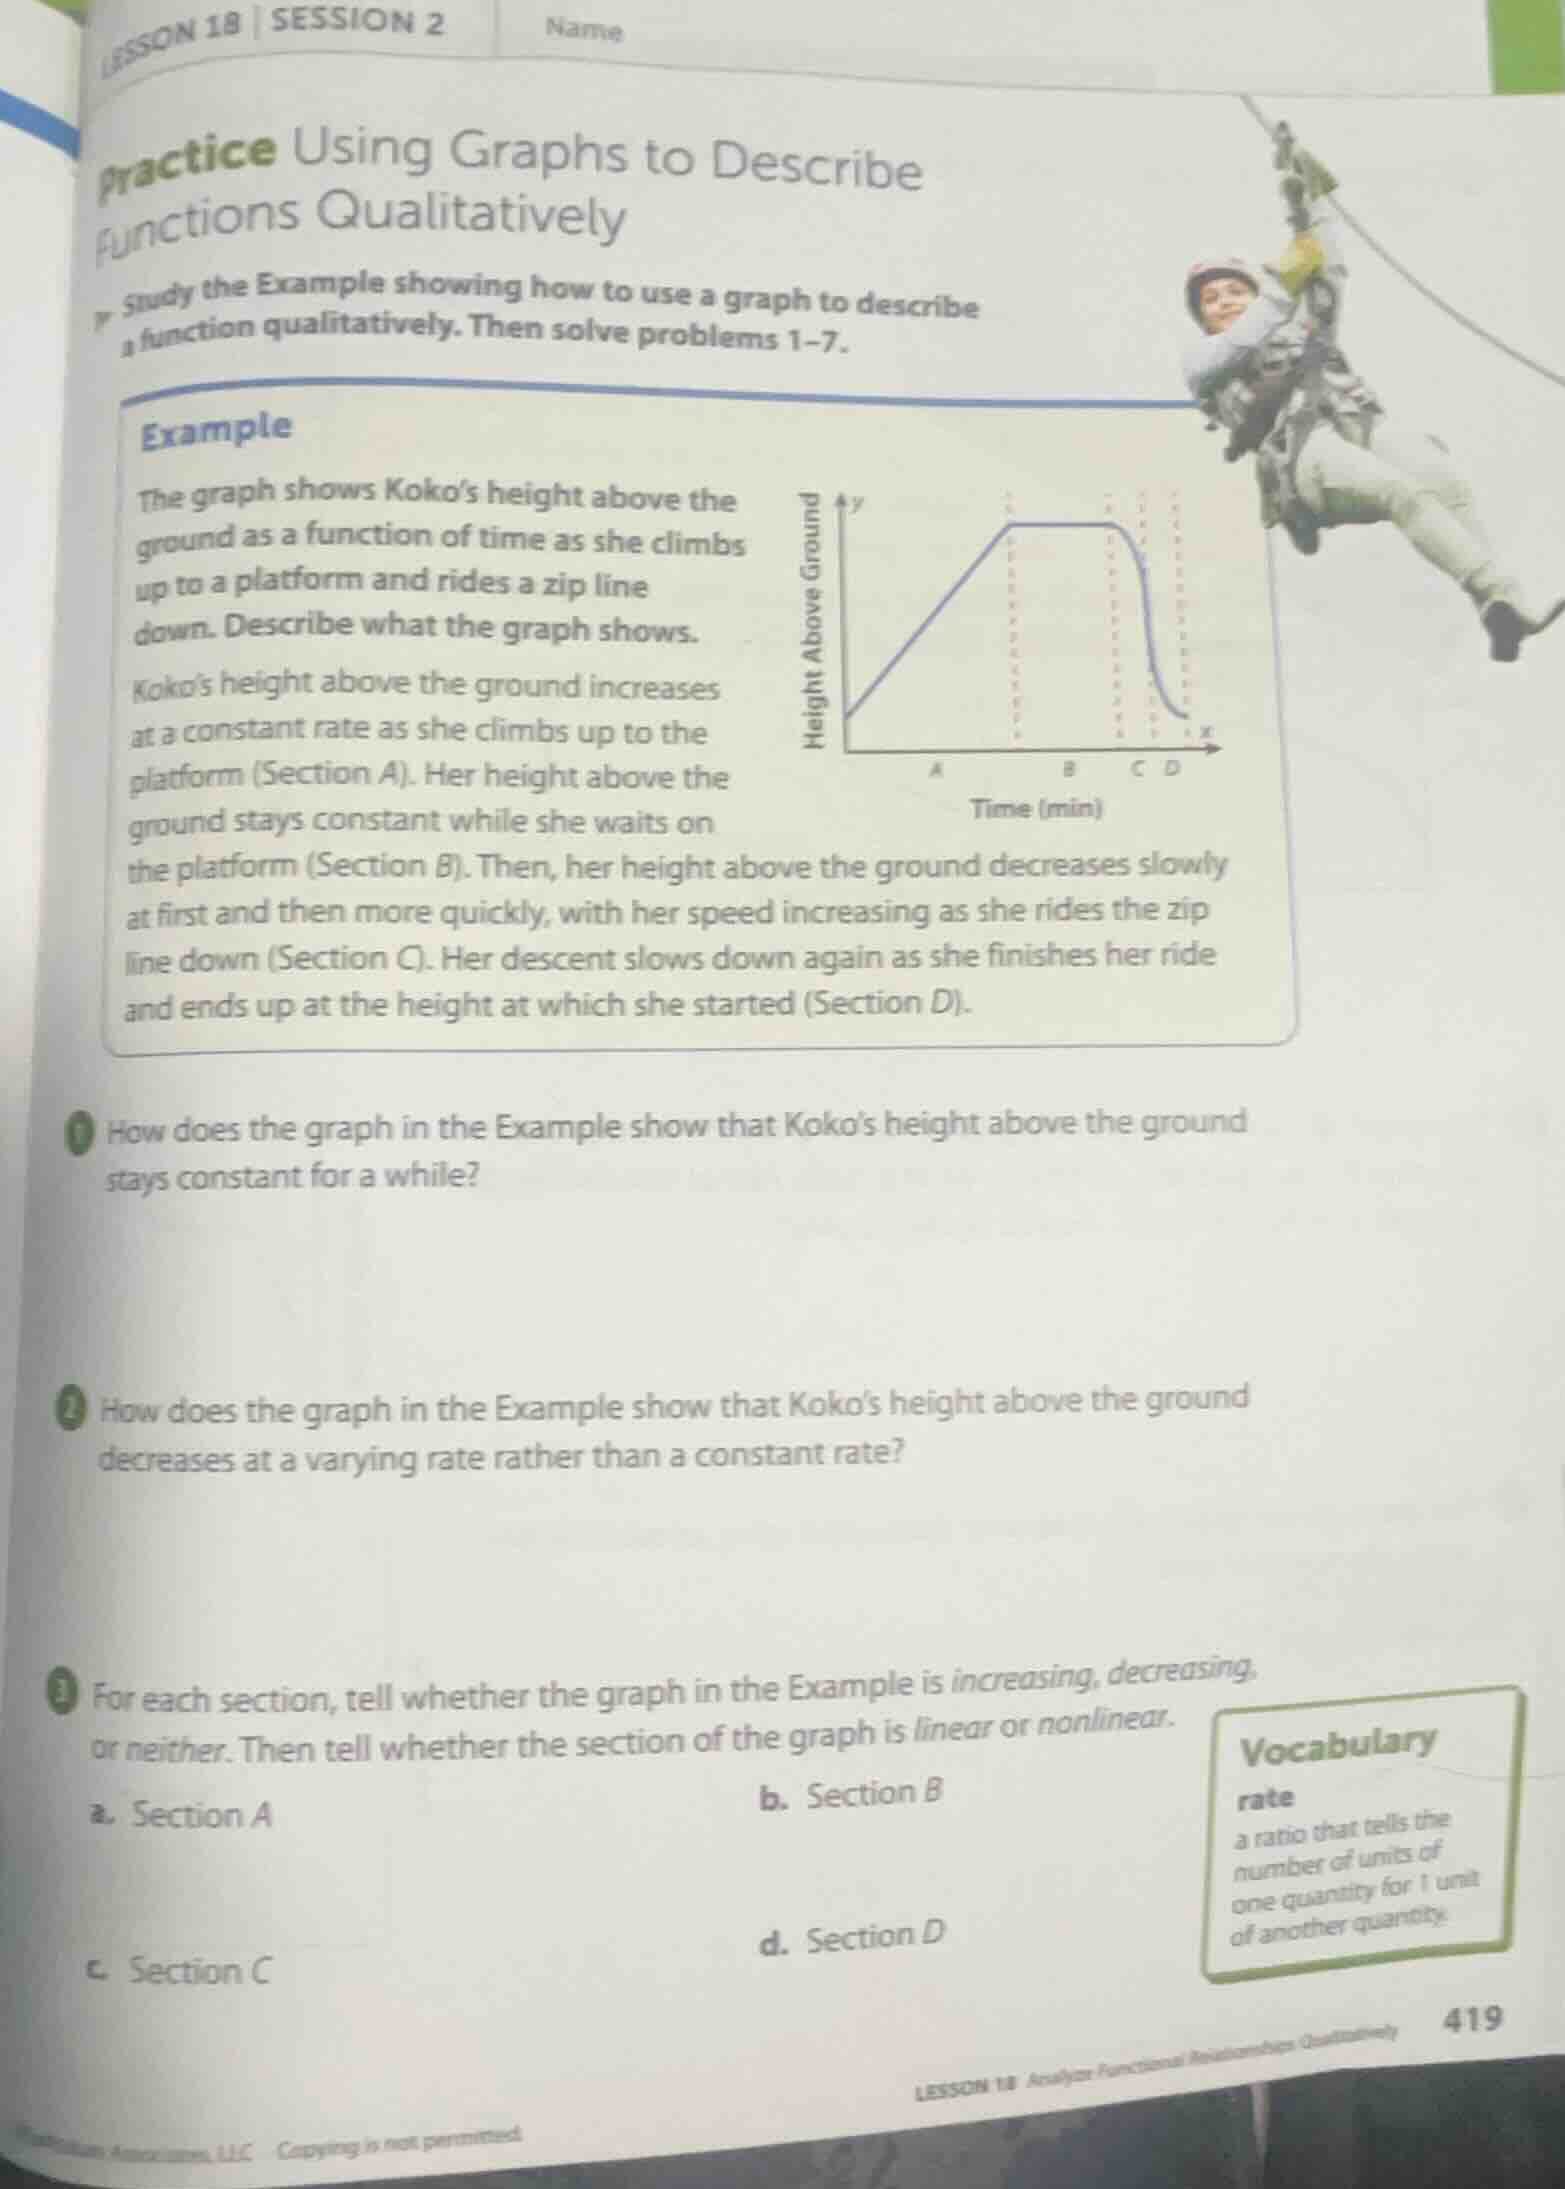
the graph shows kokos height above the
ground as a function of time as she climbs
up to a platform and rides a zip line
down. describe what the graph shows.
kokos height above the ground increases
at a constant rate as she climbs up to the
platform (section a). her height above the
ground stays constant while she waits on
the platform (section b). then, her height above the ground decreases slowly
at first and then more quickly, with her speed increasing as she rides the zip
line down (section c). her descent slows down again as she finishes her ride
and ends up at the height at which she started (section d).
1 how does the graph in the example show that kokos height above the ground
stays constant for a while?
2 how does the graph in the example show that kokos height above the ground
decreases at a varying rate rather than a constant rate?
3 for each section, tell whether the graph in the example is increasing, decreasing,
or neither. then tell whether the section of the graph is linear or nonlinear.
a. section a
b. section b
c. section c
d. section d
vocabulary
rate
a ratio that tells the
number of units of
one quantity for 1 unit
of another quantity.
lesson 18 analyze functional relationships qualitatively 419
- For question 1: A horizontal line on a time-height graph means height doesn't change as time passes, since the y-value (height) stays the same for a range of x-values (time).
- For question 2: A non-straight (curved) decreasing section means the rate of height change varies; a constant rate would be a straight downward line.
- For question 3:
- Section A: Upward straight line means increasing and linear.
- Section B: Horizontal line means neither increasing/decreasing and linear.
- Section C: Downward curved line means decreasing and nonlinear.
- Section D: Downward curved line (shallowing) means decreasing and nonlinear.

Snap & solve any problem in the app
Get step-by-step solutions on Sovi AI
Photo-based solutions with guided steps
Explore more problems and detailed explanations
- Section B of the graph is a horizontal line parallel to the time (x) axis, so Koko's height (y-value) does not change as time increases, showing her height stays constant.
- Sections C and D of the graph are curved (not straight) lines as height decreases. A constant rate of decrease would be a straight diagonal line, so the curve indicates the rate of height decrease changes over time.
3.
a. Section A: Increasing, Linear
b. Section B: Neither increasing nor decreasing, Linear
c. Section C: Decreasing, Nonlinear
d. Section D: Decreasing, Nonlinear