QUESTION IMAGE
Question
lesson 6: even more graphs of functions
cool down: walking home from school
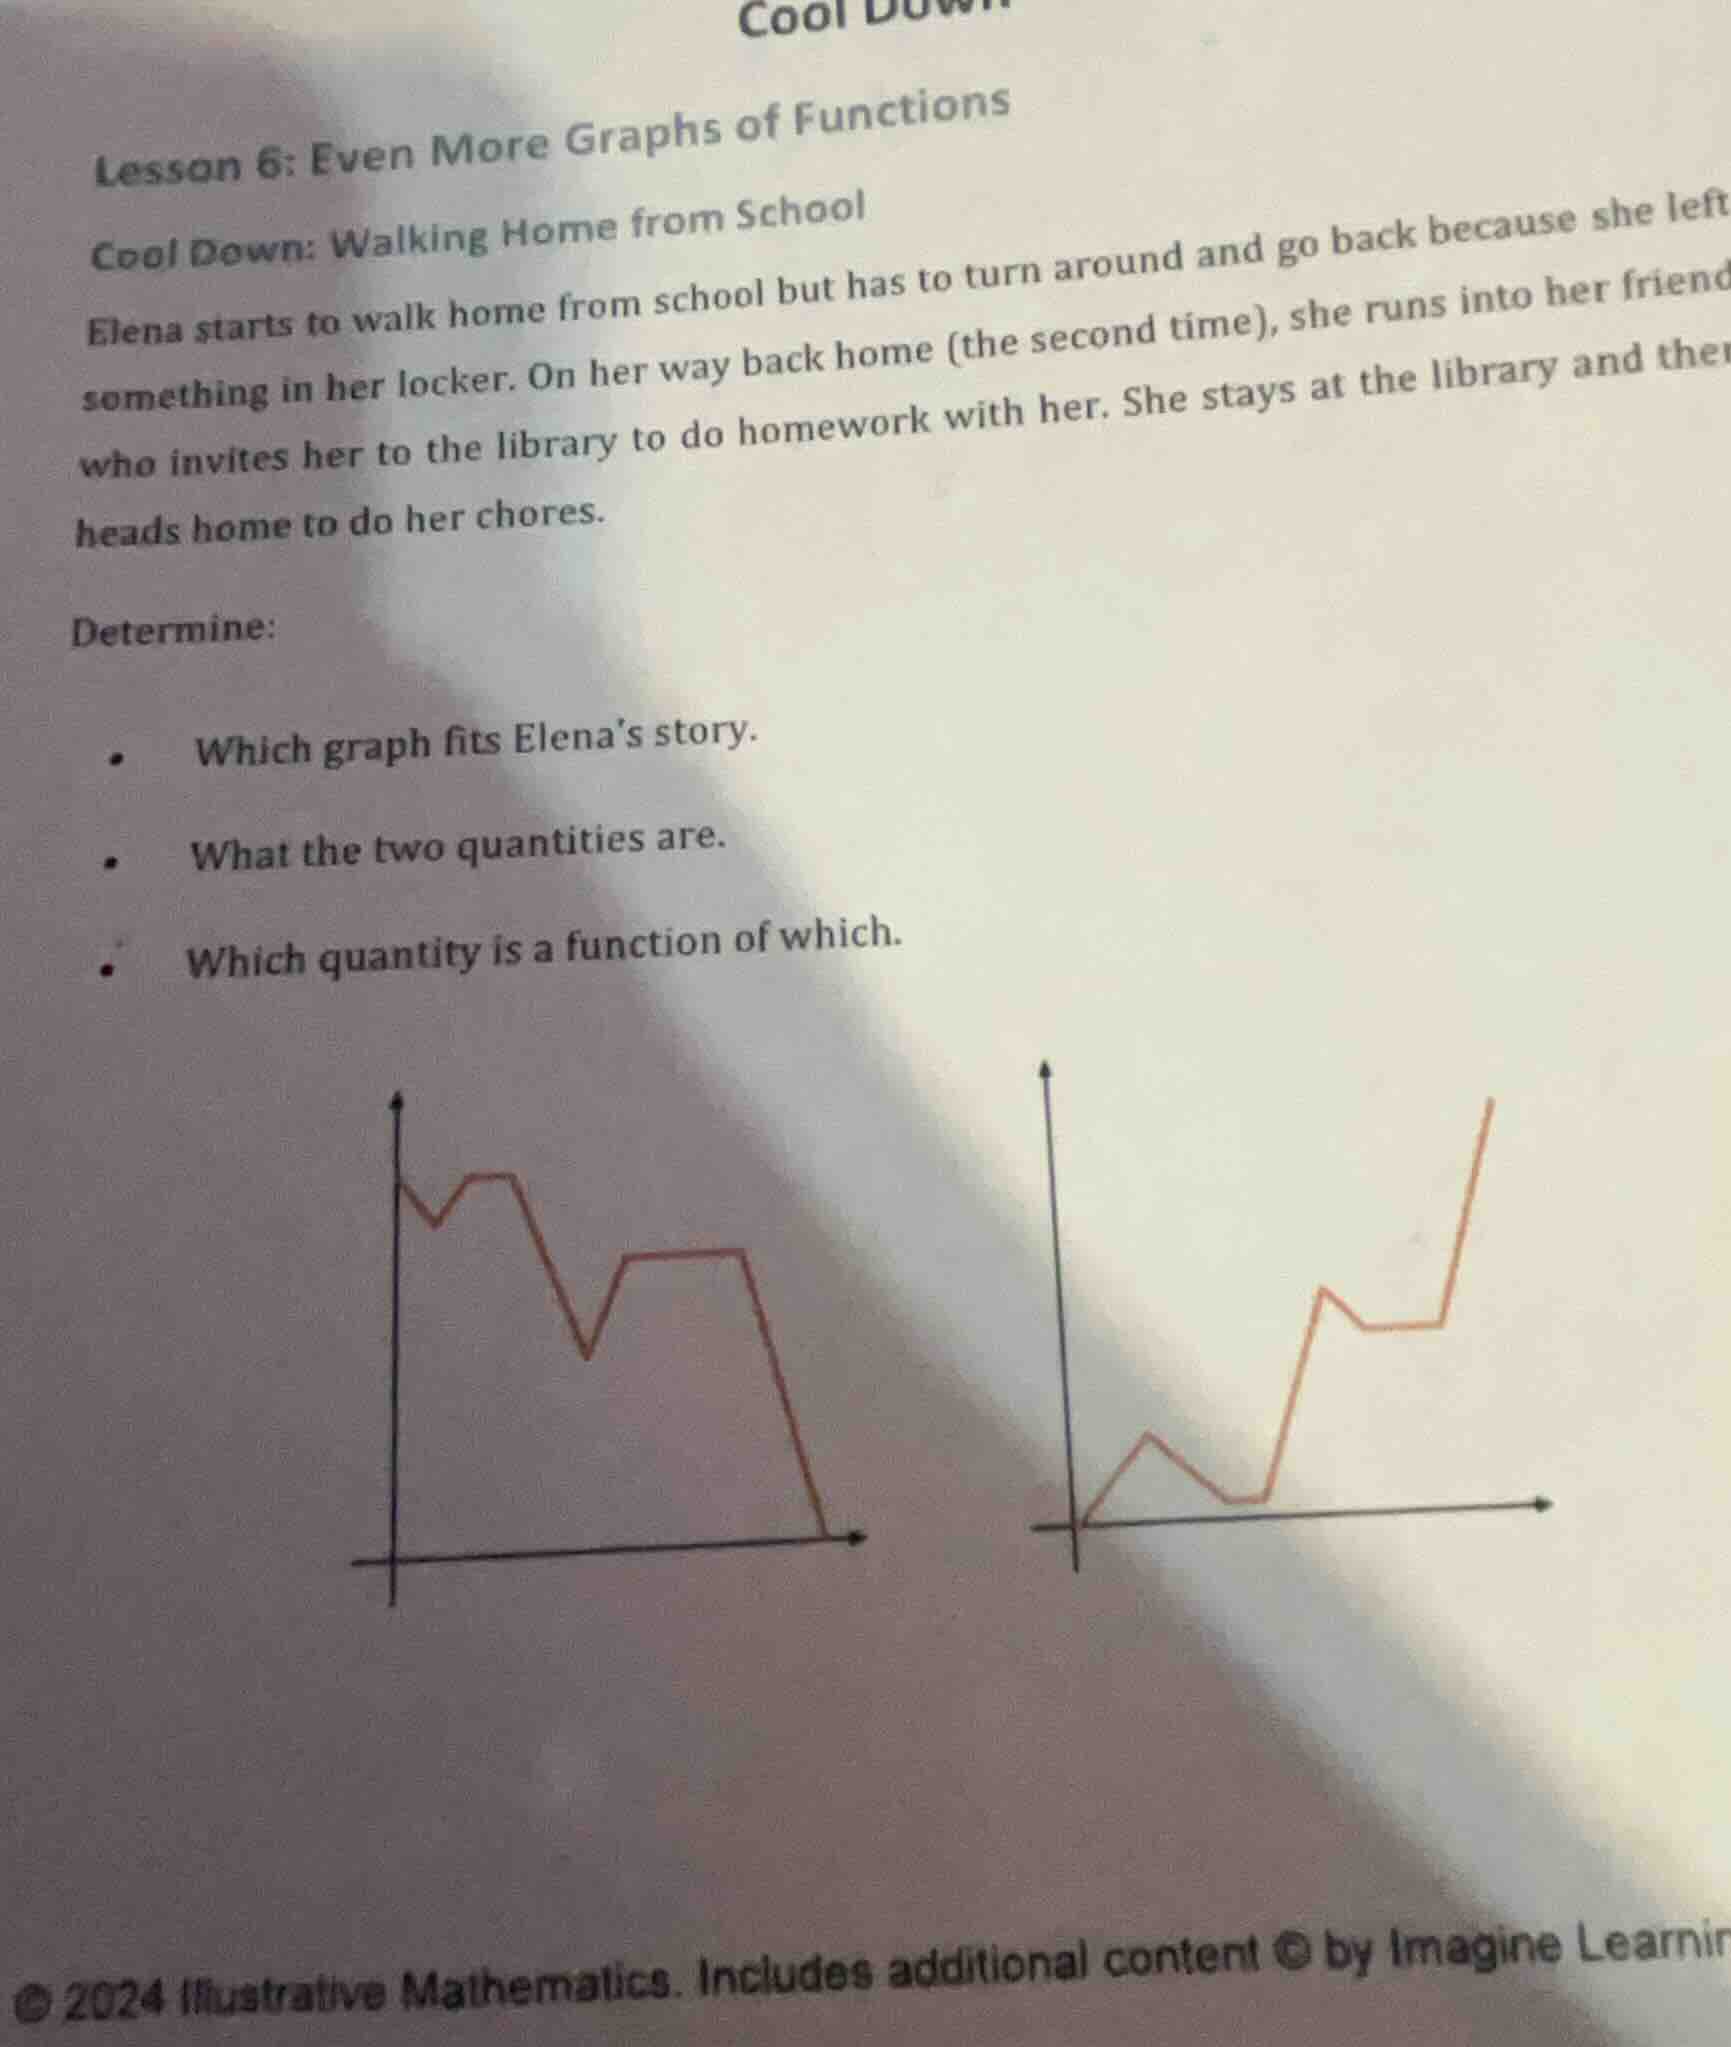
elena starts to walk home from school but has to turn around and go back because she left something in her locker. on her way back home (the second time), she runs into her friend who invites her to the library to do homework with her. she stays at the library and then heads home to do her chores.
determine:
- which graph fits elena’s story.
- what the two quantities are.
- which quantity is a function of which.
1. Which graph fits Elena’s story?
- Step 1: Analyze Elena's movements
Elena starts walking home (distance from home decreases), turns back to school (distance from home increases), then walks home again (distance decreases), stops at library (distance constant), then walks home (distance decreases to 0).
- Step 2: Match to graph
The first graph has decreasing, increasing, decreasing, constant, and decreasing segments (ending at 0), matching her story. The second graph starts at 0 (unlikely, as she starts at school, not home) and increases overall, which doesn’t fit.
2. What are the two quantities?
- Step 1: Identify variables
The story involves time (independent) and distance from home (dependent). As time passes, her distance from home changes.
3. Which quantity is a function of which?
- Step 1: Define function relationship
A function has one output (distance) for each input (time). Distance from home depends on time elapsed, so distance is a function of time.

Snap & solve any problem in the app
Get step-by-step solutions on Sovi AI
Photo-based solutions with guided steps
Explore more problems and detailed explanations
s:
- Graph fitting the story: The first graph (with decreasing, increasing, decreasing, constant, and decreasing segments ending at 0).
- Two quantities: Time (elapsed) and distance from home.
- Function relationship: Distance from home is a function of time.