QUESTION IMAGE
Question
lesson 3: representing proportional...
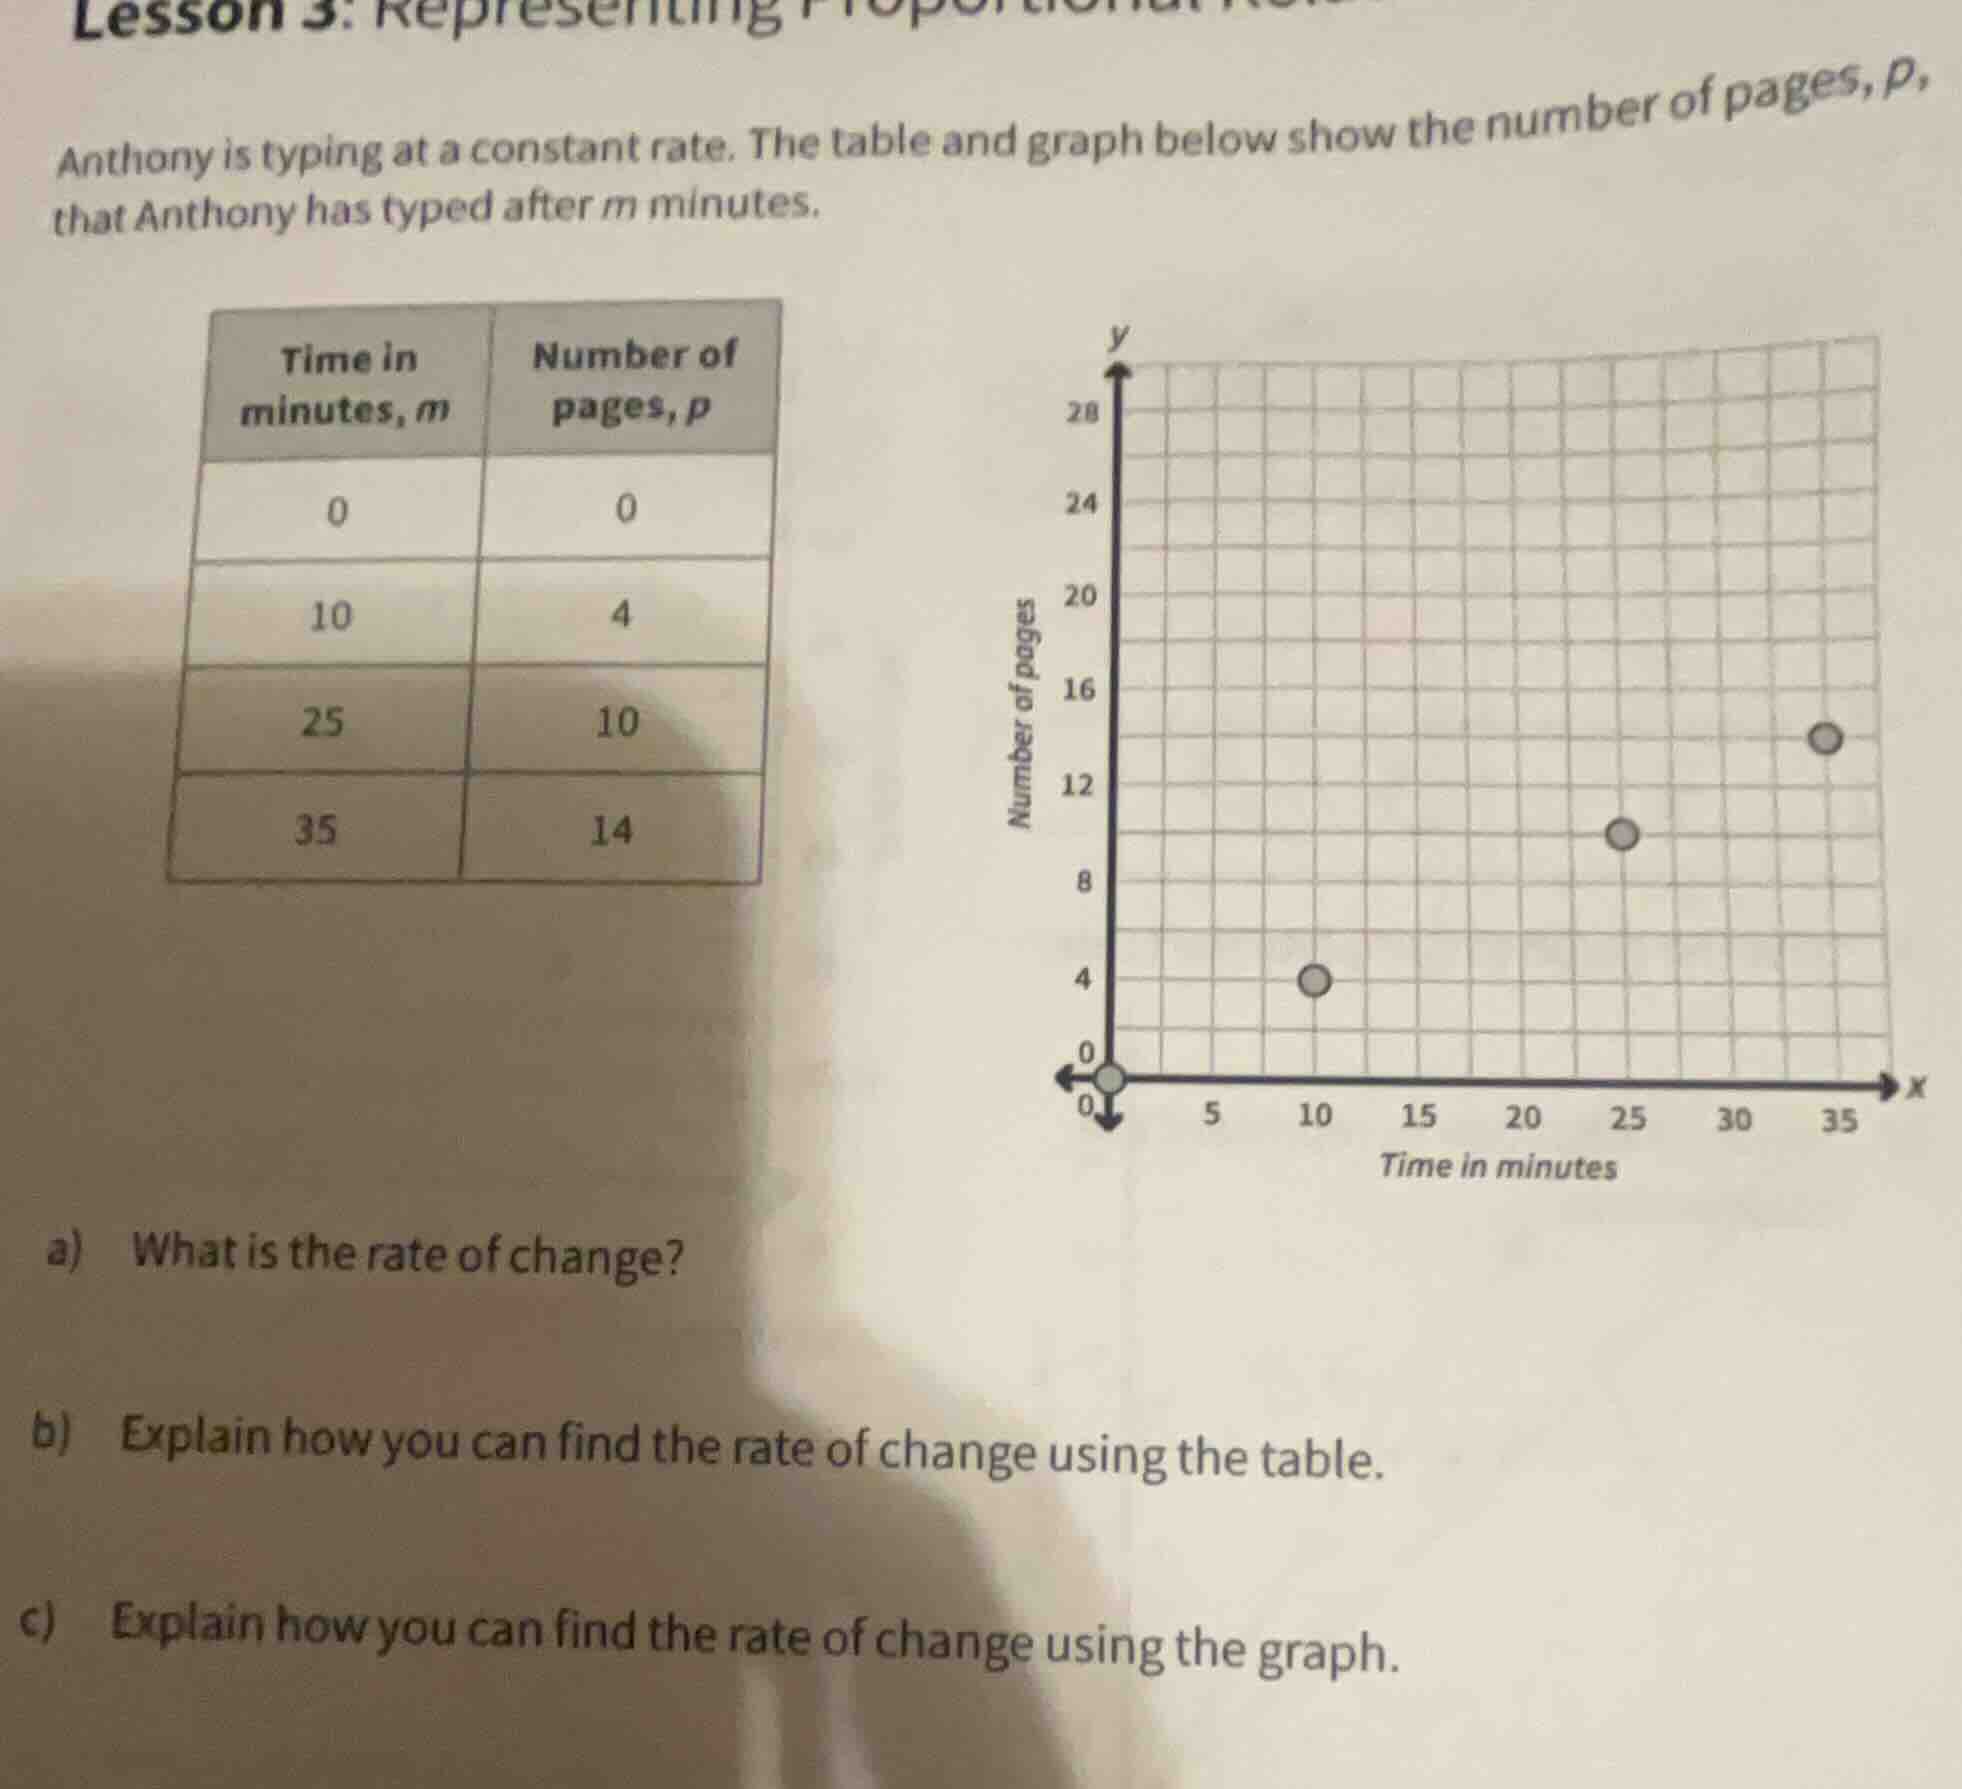
anthony is typing at a constant rate. the table and graph below show the number of pages, p, that anthony has typed after m minutes.
(table: time in minutes, m | number of pages, p; 0 | 0; 10 | 4; 25 | 10; 35 | 14)
(graph: x - time in minutes, y - number of pages; points at (0,0), (10,4), (25,10), (35,14))
a) what is the rate of change?
b) explain how you can find the rate of change using the table.
c) explain how you can find the rate of change using the graph.

Snap & solve any problem in the app
Get step-by-step solutions on Sovi AI
Photo-based solutions with guided steps
Explore more problems and detailed explanations
a) $0.4$ pages per minute
b) Divide the number of pages ($p$) by the time in minutes ($m$) for any row except $(0,0)$, such as $\frac{4}{10} = 0.4$.
c) Determine the slope of the line by calculating the "rise over run" between two points, such as $\frac{4 - 0}{10 - 0} = 0.4$.