QUESTION IMAGE
Question
lessons 1-8 to 1-10b
- consider the following test scores earned by students in mr. hastert’s history class.
45 63 65 70 71 71 74 86
a. calculate the mean.
68.25
b. what is the mode?
71
c. calculate the median (q2).
70.5
d. what is q1?
64
e. what is q3?
72.5
f. find the interquartile range (iqr)
63
g. state the range.
41
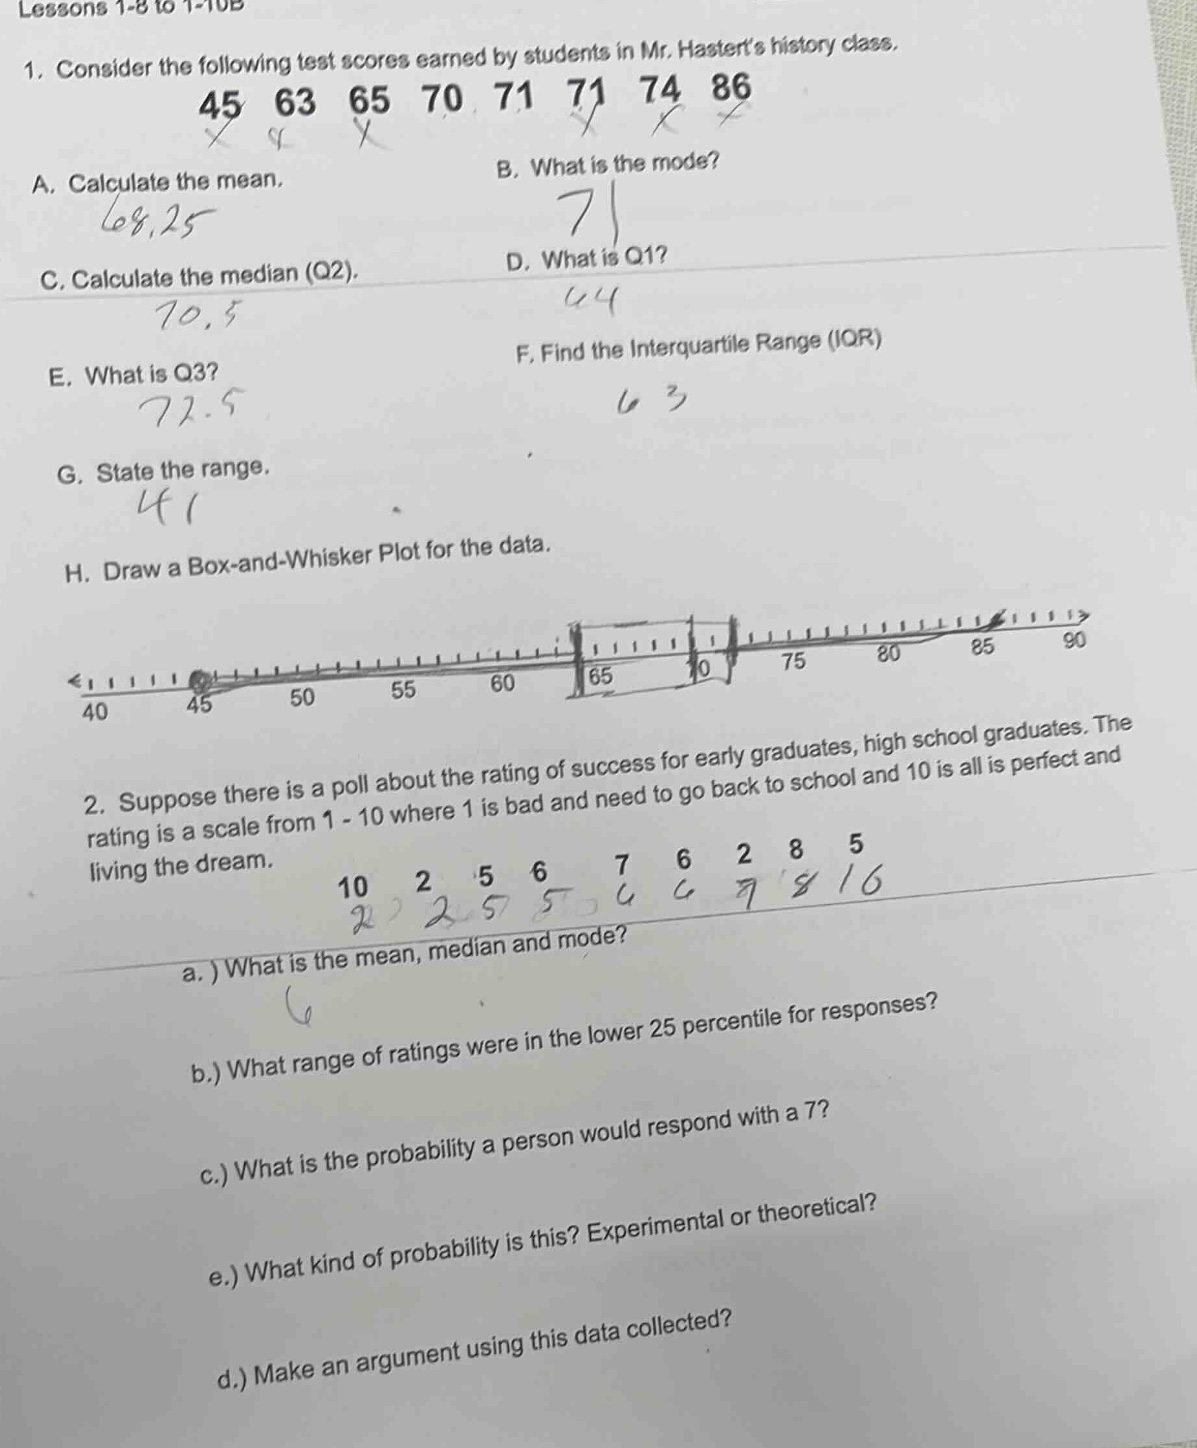
h. draw a box-and-whisker plot for the data.
box - and - whisker plot image with number line from 40 to 90
- suppose there is a poll about the rating of success for early graduates, high school graduates. the rating is a scale from 1 - 10 where 1 is bad and need to go back to school and 10 is all is perfect and living the dream.
10 2 5 6 7 6 2 8 5
2 2 5 5 6 6 7 8 10
a.) what is the mean, median and mode?
6
b.) what range of ratings were in the lower 25 percentile for responses?
c.) what is the probability a person would respond with a 7?
e.) what kind of probability is this? experimental or theoretical?
d.) make an argument using this data collected?
Problem 1 (Test Scores: 45, 63, 65, 70, 71, 71, 74, 86)
A. Calculate the Mean
Step1: Sum all scores
$45 + 63 + 65 + 70 + 71 + 71 + 74 + 86 = 545$
Step2: Divide by number of scores (8)
$\frac{545}{8} = 68.125$
The mode is the most frequent value. 71 appears twice, others once.
Step1: Order data (already ordered: 45, 63, 65, 70, 71, 71, 74, 86)
Step2: Middle two values (4th and 5th: 70, 71)
Step3: Average them: $\frac{70 + 71}{2} = 70.5$

Snap & solve any problem in the app
Get step-by-step solutions on Sovi AI
Photo-based solutions with guided steps
Explore more problems and detailed explanations
$68.125$