QUESTION IMAGE
Question
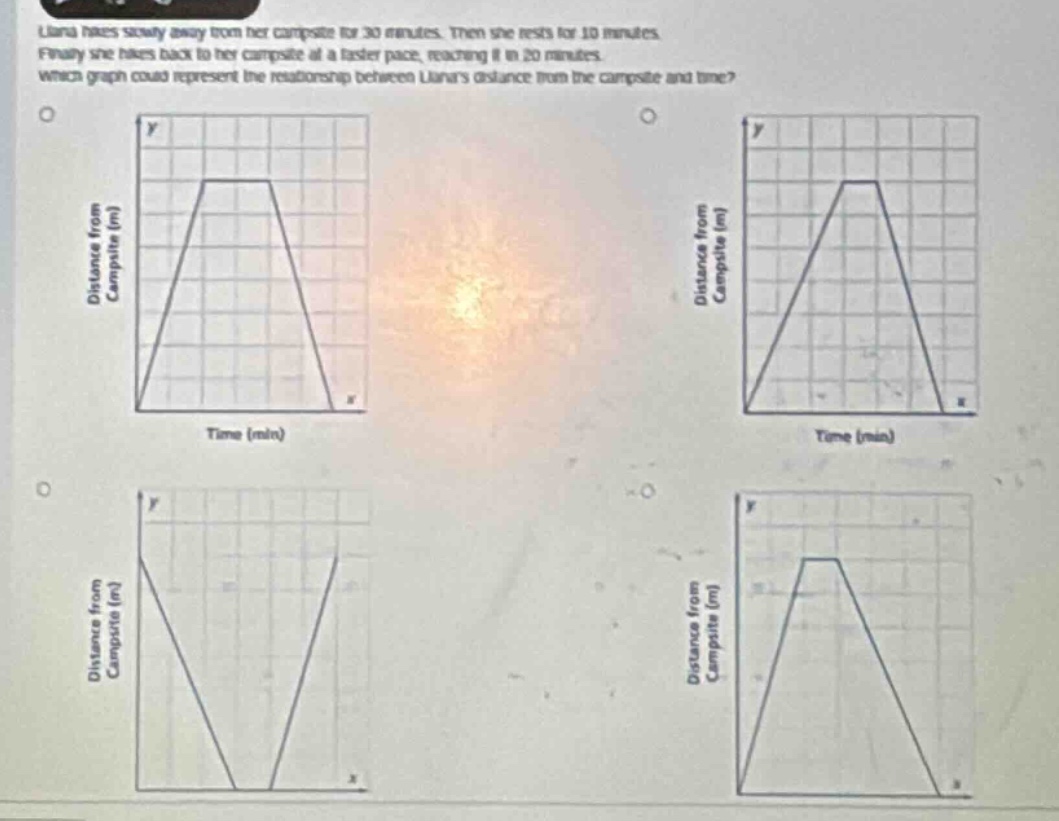
liana hikes slowly away from her campsite for 30 minutes. then she rests for 10 minutes. finally she hikes back to her campsite at a faster pace, reaching it in 20 minutes. which graph could represent the relationship between liana’s distance from the campsite and time?
Response
To determine the correct graph, we analyze Liana's actions over time:
Step 1: Hiking away (30 minutes)
- Distance vs. Time: Distance increases linearly (since she hikes at a steady pace) over 30 minutes. The graph should show a rising line for the first 30 minutes.
Step 2: Resting (10 minutes)
- Distance vs. Time: Distance remains constant (she is resting, so no change in distance from the campsite). The graph should show a horizontal line (flat segment) for the next 10 minutes.
Step 3: Hiking back (20 minutes)
- Distance vs. Time: Distance decreases linearly (faster pace means a steeper slope downward) until she returns to the campsite (distance = 0) after 20 minutes. The slope here should be steeper (more negative) than the slope of the “hiking away” segment (since 20 minutes < 30 minutes for the same distance, speed is higher, so steeper slope).
Now, we evaluate the graphs:
- The first graph (top - left) has a rising segment (30 min), a flat segment (10 min), and a steeper falling segment (20 min) – this matches the analysis.
- The second graph (top - right) has no flat segment (no resting period), so it is incorrect.
- The third graph (bottom - left) starts with distance decreasing (opposite of “hiking away”), so it is incorrect.
- The fourth graph (bottom - right) has a flat segment, but the falling slope is not steeper than the rising slope (since the time to return is 20 min, the slope should be steeper), so it is incorrect.

Snap & solve any problem in the app
Get step-by-step solutions on Sovi AI
Photo-based solutions with guided steps
Explore more problems and detailed explanations
The top - left graph (with a rising segment, a flat segment, and a steeper falling segment)