QUESTION IMAGE
Question
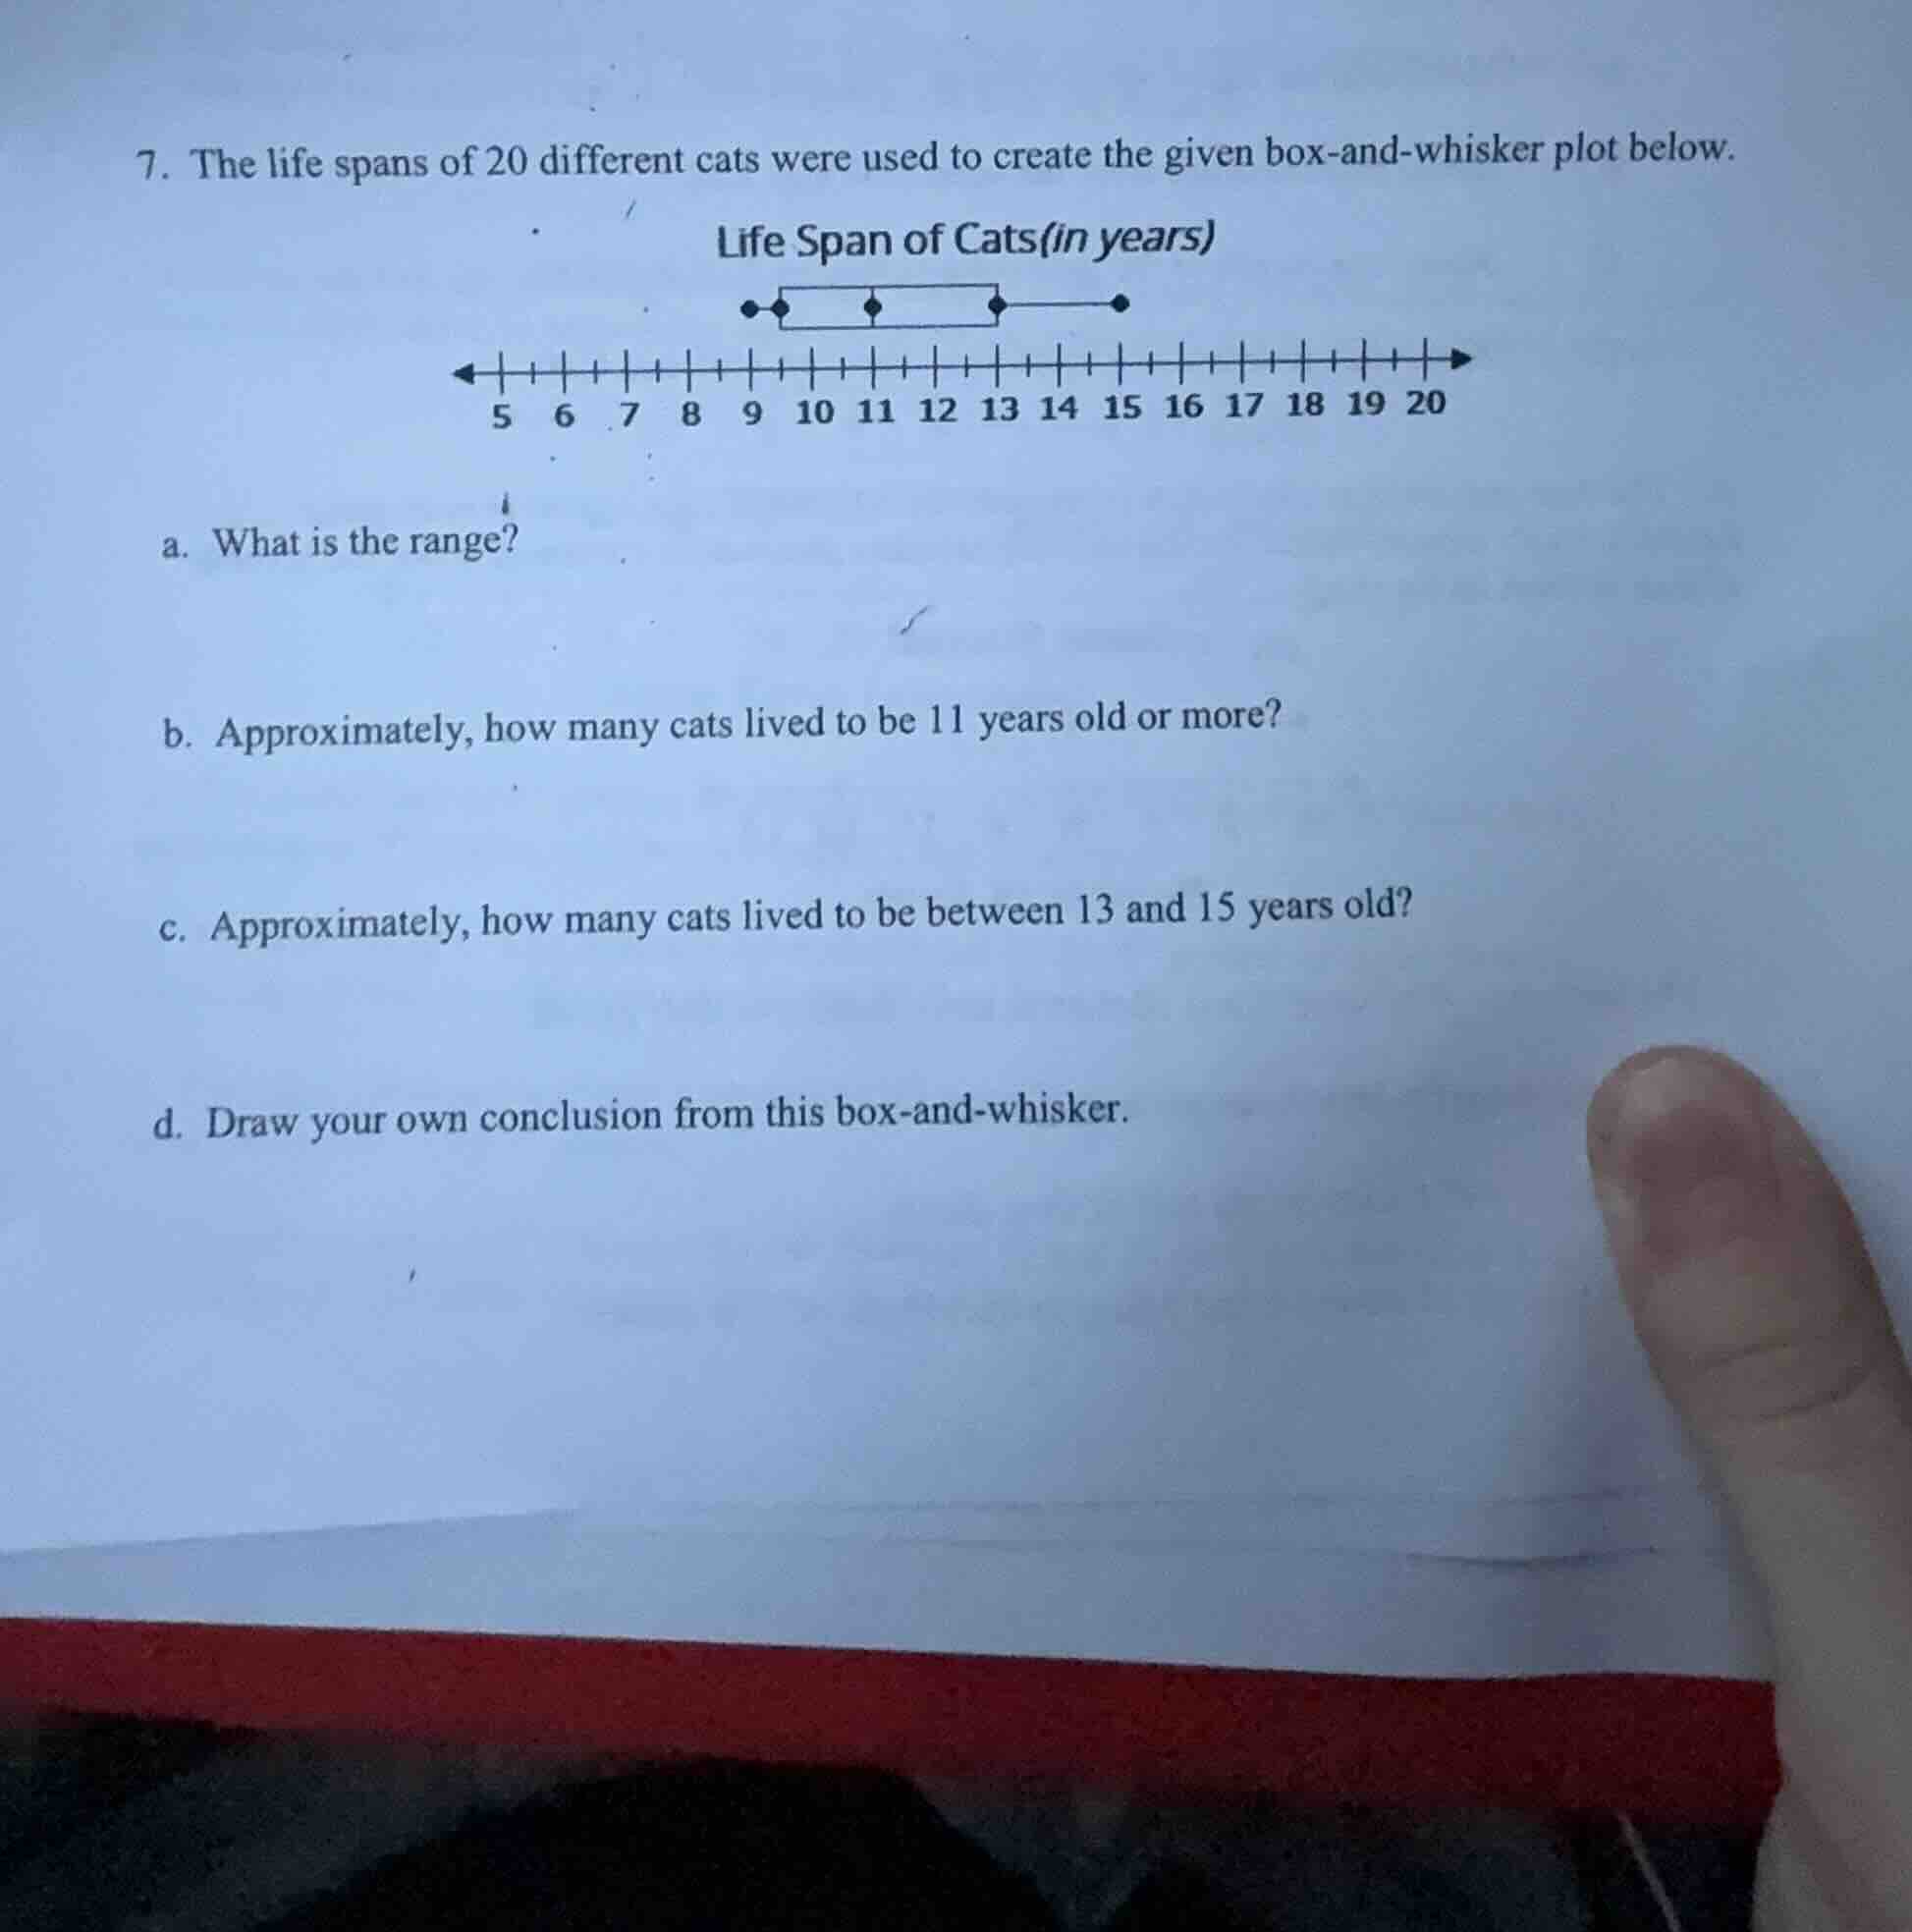
- the life spans of 20 different cats were used to create the given box-and-whisker plot below.
life span of cats(in years)
a. what is the range?
b. approximately, how many cats lived to be 11 years old or more?
c. approximately, how many cats lived to be between 13 and 15 years old?
d. draw your own conclusion from this box-and-whisker.
Step1: Find range (max - min)
From the plot, max = 16, min = 8.
$\text{Range} = 16 - 8$
Step2: Calculate cats ≥11 years
11 is the median, so 50% of 20 cats.
$\text{Number} = 0.5 \times 20$
Step3: Calculate cats 13-15 years
13 is Q3, 15 is between Q3 and max (25% of data). 15 to 16 is half of that, so 12.5% of 20.
$\text{Number} = 0.125 \times 20$
Step4: Interpret box plot trends
Analyze spread and central tendency.

Snap & solve any problem in the app
Get step-by-step solutions on Sovi AI
Photo-based solutions with guided steps
Explore more problems and detailed explanations
a. 8 years
b. 10 cats
c. 2-3 cats (2 cats as approximate whole number)
d. The middle 50% of cats have a life span between 9 and 13 years, and the typical (median) cat life span is 11 years. The overall life span of the cats ranges from 8 to 16 years, with no extreme outliers outside this range.