QUESTION IMAGE
Question
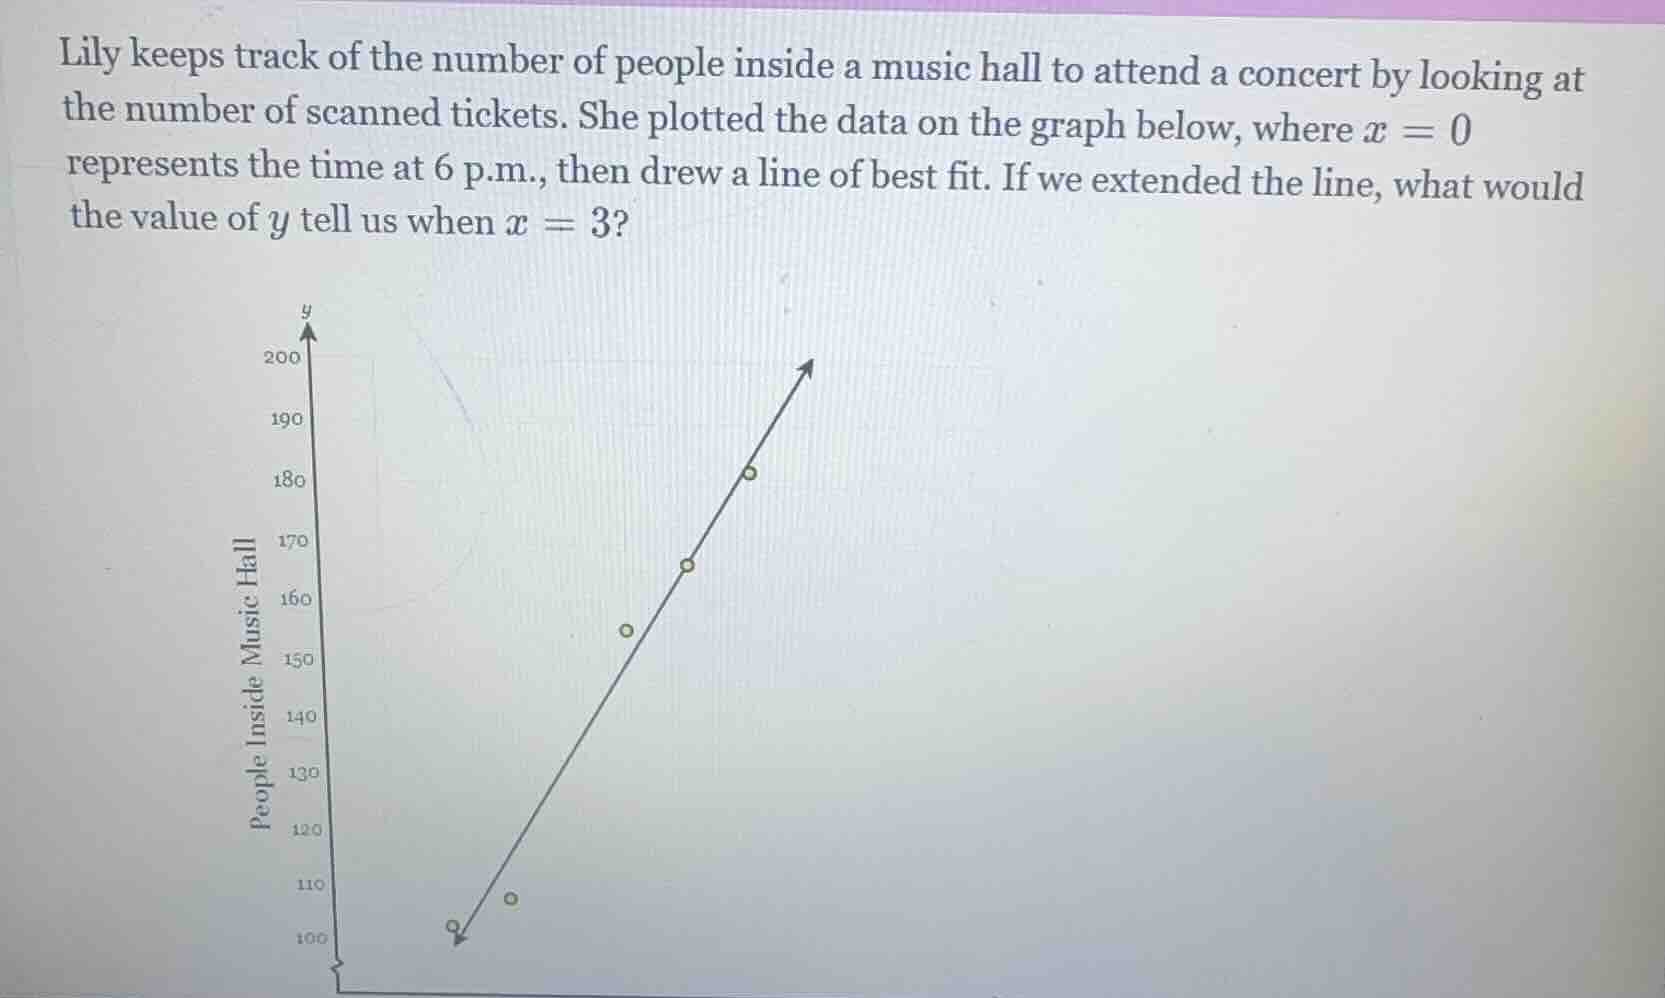
lily keeps track of the number of people inside a music hall to attend a concert by looking at the number of scanned tickets. she plotted the data on the graph below, where ( x = 0 ) represents the time at 6 p.m., then drew a line of best fit. if we extended the line, what would the value of ( y ) tell us when ( x = 3 )?
First, interpret the variables: $x=0$ is 6 p.m., so $x=3$ is 3 hours after 6 p.m., which is 9 p.m. The $y$-axis represents the number of people inside the music hall, and the line of best fit predicts this number. Extending the line gives the predicted number of people at that time.

Snap & solve any problem in the app
Get step-by-step solutions on Sovi AI
Photo-based solutions with guided steps
Explore more problems and detailed explanations
The value of $y$ would tell us the predicted number of people inside the music hall at 9 p.m. (3 hours after 6 p.m.).